
In brief
- XRP surged above $3 today after weeks of sideways actions and bearish sentiment.
- Prediction market users on Myriad say there's a 55% chance XRP hits $4 before dumping back to $2.
- The charts suggest caution. Here's why.
After weeks of sideways chop, XRP—the cryptocurrency created by the founders of Ripple—is making another run at the ever important $3.00 per coin mark.
XRP is up 4% today trading just above $3.00, climbing more than 9% over the last 30 days. It’s enough to claim a top 3 spot in the crypto market, with a market cap above $182 billion.
The move comes as the broader crypto market shows signs of life, with Bitcoin holding steady above $110,000—just above $120K right now—and institutional interest in XRP derivatives reaching new highs with CME's upcoming 24/7 futures launch.
So are the good times back again for the XRP Army as we march into ‘Uptober’?
On Myriad, a prediction market built by Decrypt’s parent company Dastan, traders are leaning slightly bullish on the Ripple-linked token at the moment. Traders have set the line at 55% that XRP sooner pumps to $4 than dives all the way back down to $2. Those odds have completely flipped relative to where they were just last week, when traders had placed a 56% chance of XRP plummeting.
In other words, the market now appears to see stronger potential for upside on XRP but Myriad traders aren’t yet willing to bet the farm on it. What do the charts have to say about it?
XRP price: Mixed signals beneath the surface
Today’s candlestick shows XRP climbing from an opening price of $2.9485 to test intraday highs of $3.0599—a 3.8% spike from the daily low of $2.9424. This is basically a continuation of a price bounce that started on September 26 when XRP was trading at around $2.70.
While the price action looks encouraging on the surface, a deeper dive into the technicals reveals a more nuanced picture that should give bulls pause before declaring victory.
The charts reveal XRP trapped in a horizontal channel following a descending triangle pattern that was in place since the July highs near $3.80. Today's move brings the token right to the upper boundary of this channel, creating a critical inflection point that could determine the next major move.
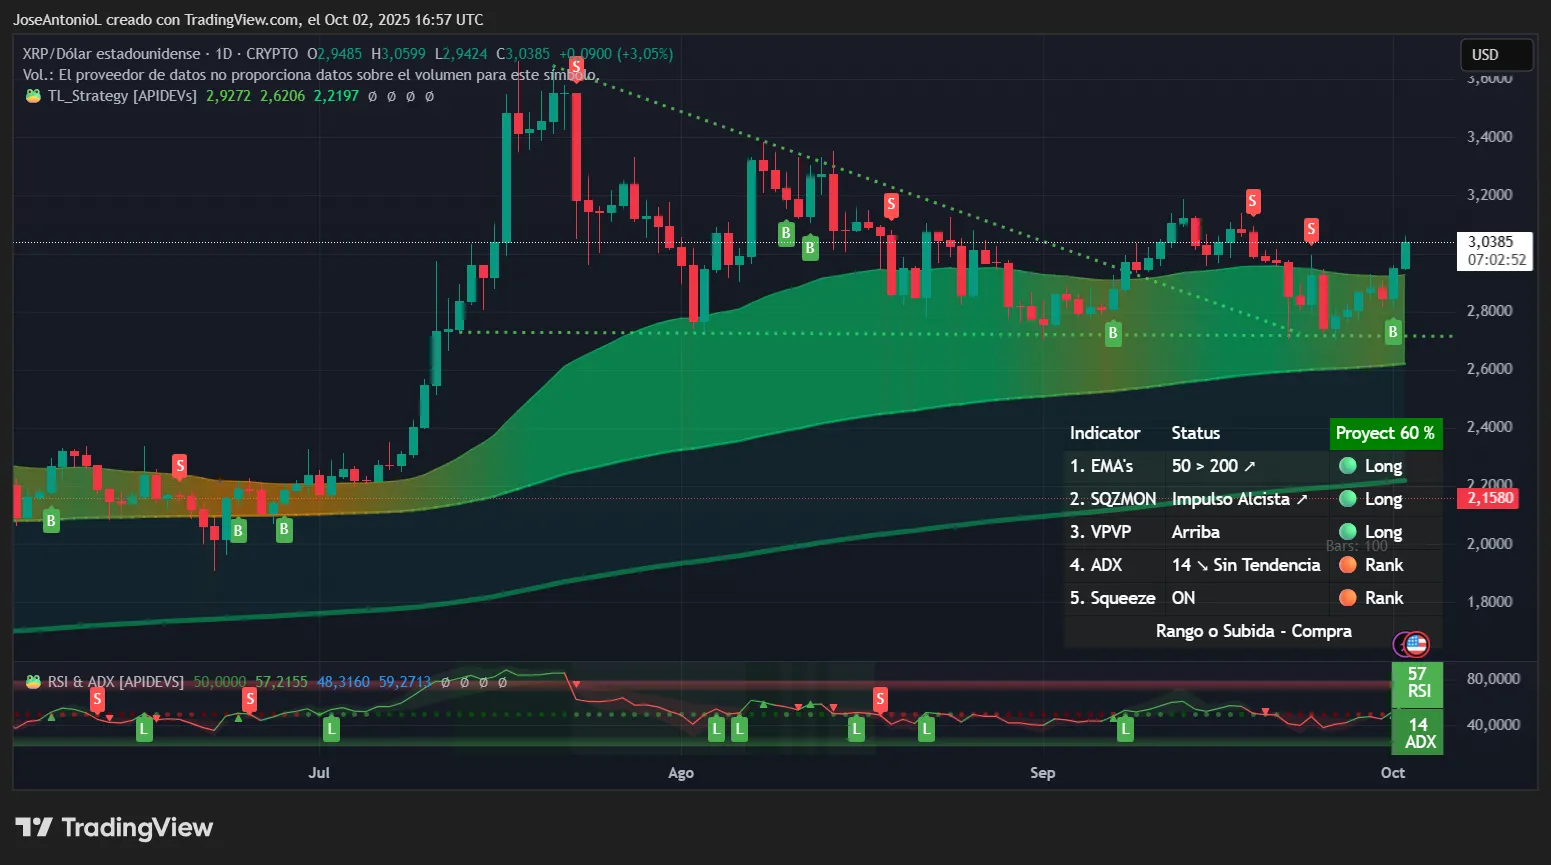
The Average Directional Index, or ADX, for XRP sits at a concerning 14, well below the 25 threshold that confirms trend strength. ADX measures trend strength regardless of direction, with scores above 25 signalling to traders that an actual trend is in place.
This weak reading for XRP suggests the market lacks conviction despite today's gains—traders typically view ADX below 20 as a sign of directionless, choppy price action where false breakouts are common. Think of it as a car engine running but not in gear; there's energy but no clear direction.
Meanwhile, the exponential moving averages tell a more optimistic story. Exponential moving averages, or EMAs, give traders an idea of where the price supports and resistances are based on average prices over the short, medium, and longer term.
The 50-day EMA for XRP is hovering around the $3.00 zone, and that’s providing dynamic resistance that coincides perfectly with the psychological round number. This confluence creates a formidable barrier that bulls must decisively conquer. The good news? The 200-day EMA sits comfortably lower at around $2.70, offering a solid safety net well above the bearish threshold. When the 50-day EMA trades above the 200-day, as it does here, it typically signals the longer-term uptrend remains intact even if short-term momentum wavers.
Things are so trendless that both EMAs are running in parallel right now.
The Relative Strength Index, or RSI, is at 57, which places XRP in neutral territory—not overbought enough to trigger profit-taking, but not oversold enough to attract bargain hunters.
All things considered, traders would largely consider this to be an obvious compression scenario. Some may opt to do small trades with supports and resistances acting as triggers for stop loss and take-profit orders, so that this “boring” phrase can be somewhat profitable.
The Squeeze Momentum Indicator showing "on" status would also support this thesis. Combined with all the other neural indicators, this could suggest we're approaching a decisive moment—but the weak ADX warns the breakout attempt could fail.
To 3 or not to 3, that is the question
Here's the reality check: $3.00 might be asking too much from XRP right now based on current conditions. The convergence of the 50-day EMA with this psychological level creates a double whammy of resistance that's proven stubborn in recent attempts. If the coin continues trading sideways, this barrier could hold firm, potentially sending XRP slightly lower to test support.
However, experienced traders would likely avoid opening overly leveraged positions that trigger liquidation near this priceline. This support is weak, and the coin may trade below it without turning bearish in the short term.
The silver lining? The $2.70 zone offers much more solid footing. Not only does this level sit comfortably above the 200-day EMA (maintaining the bullish structure), but it also aligns with previous consolidation areas that have acted as springboards for rallies. This means even if bulls can't hold $3.00, the correction should find buyers before turning truly bearish.
XRP's 3% pop today is likely encouraging for bulls, but the technical picture suggests a more cautious approach may be prudent. The ADX at 14 shows this isn't a trending market yet so neither bulls nor bears have control. The Squeeze indicator warns a big move is coming, but weak momentum metrics suggest it might not be the bullish breakout holders are hoping for.
Smart money should watch for a few daily closes above $3.10 with rising ADX as confirmation of a legitimate breakout. Otherwise, expect more sideways grind with $2.70 as the line in the sand bulls must defend.
Key levels to watch:
- Resistance: $3.06 (immediate), $3.14 (channel top), $3.31 (breakout target)
- Support: $2.95 (EMA50), $2.70 (strong support), $2.60 (200-EMA zone)
Disclaimer
The views and opinions expressed by the author are for informational purposes only and do not constitute financial, investment, or other advice.