

In brief
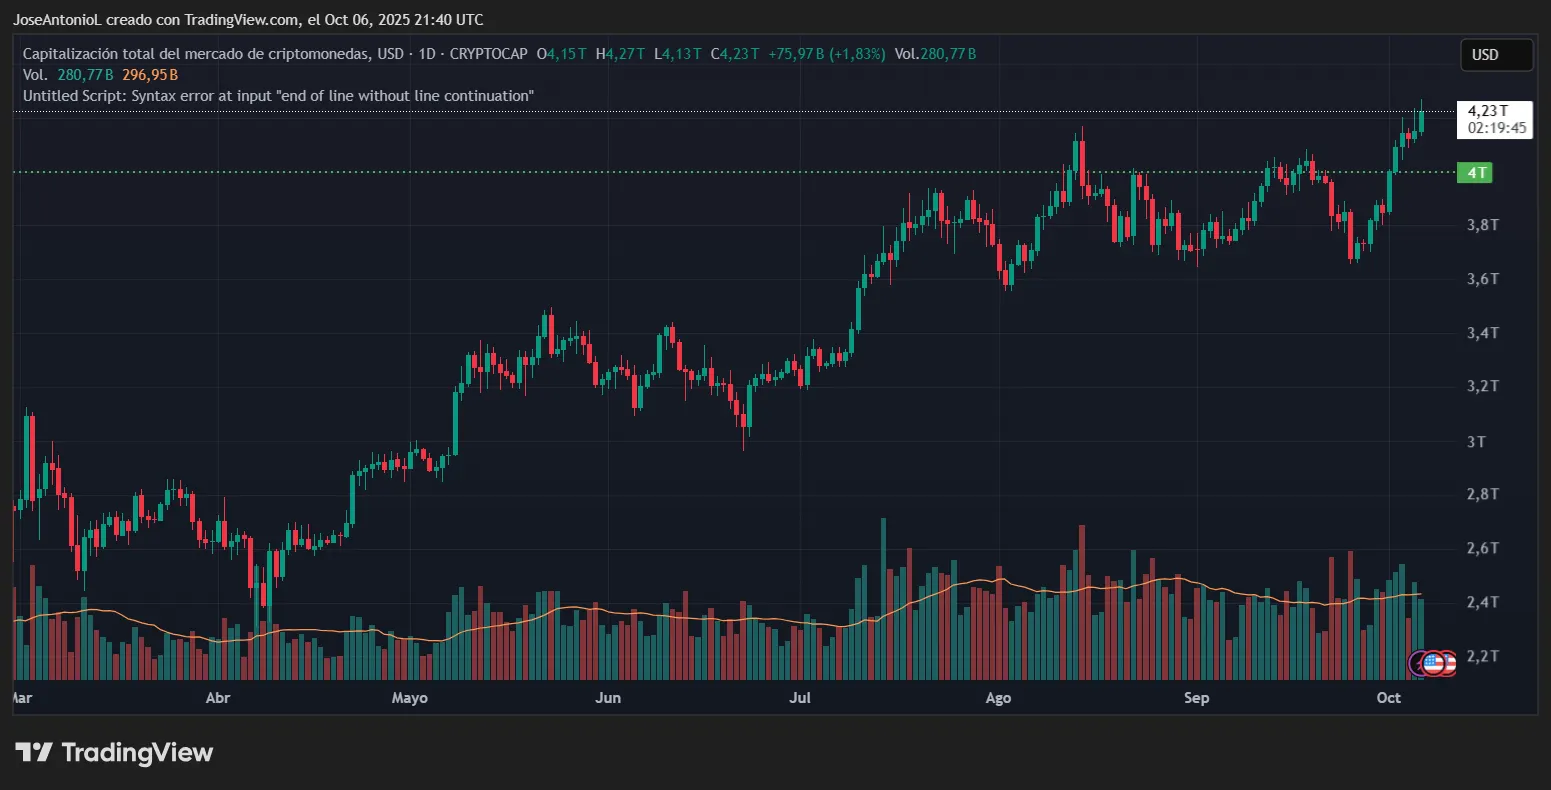
- Global crypto market cap hit an all-time high of $4.35 trillion on October 6, with Bitcoin surging past $126,000 and Ethereum crossing $4,500.
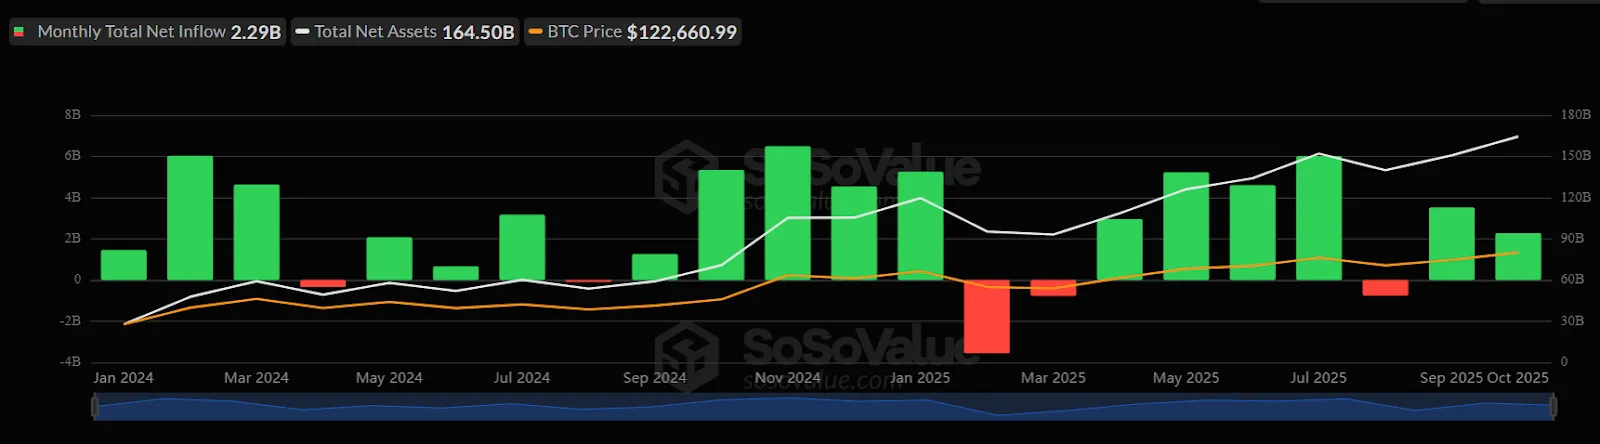
- Spot Bitcoin and Ethereum ETFs have attracted over $70 billion in inflows since January 2025, with last week alone seeing $4.5 billion in record flows.
- Technical indicators show mixed signals: bullish momentum remains strong, but there are signs of exhaustion.
October is living up to its nickname. "Uptober"—the crypto community's term for what's historically been Bitcoin's most bullish month—has arrived with fireworks, catapulting the entire crypto market past $4.35 trillion in total value on Monday. Bitcoin smashed through its previous all-time high over the weekend, peaking at $126,080 before settling around $124,100, while Ethereum sailed past $4,500.
Despite a relatively small correction today, with Bitcoin falling roughly 2.5% to $122,000, the overall trajectory remains clear. And the rally comes at a peculiar moment: the U.S. federal government entered a shutdown on October 1, yet rather than sparking panic, it seems to have accelerated the so-called "debasement trade" as investors flee toward hard assets. Traditional markets are showing cracks—the S&P 500 has wobbled amid political uncertainty—but crypto is thriving.
So, for those optimists, here’s the historical view of markets during Uptober: Bitcoin has closed October in positive territory 10 out of the past 12 years, boasting an 83% success rate with average monthly gains ranging between 14% and 22%.
This year's rally has institutional fingerprints all over it: spot Bitcoin and Ethereum ETFs have hoovered up more than $70 billion in inflows since January 2025, validating cryptocurrencies as mainstream investment vehicles. Last week alone saw $3.24 billion rush into Bitcoin ETFs—the second-largest weekly inflow on record.
Bitcoin's market cap briefly topped $2.5 trillion, making it the world's seventh most valuable asset and surpassing the entire GDP of the United Kingdom. But here's the question: Can the party continue, or are we approaching overbought territory?
Bitcoin (BTC) price: Strong but potentially nearing exhaustion
Bitcoin's current price action shows strength, but technical indicators reveal some yellow flags beneath the surface. The cryptocurrency has climbed roughly 11% over the past seven days, pushing from around $112,000 at the start of October to its peak above $126,000. It is currently trading at around $122K after a post-all-time-high correction.
For long-term trend analysis, we will be using the seven-days setup instead of the usual daily charts.
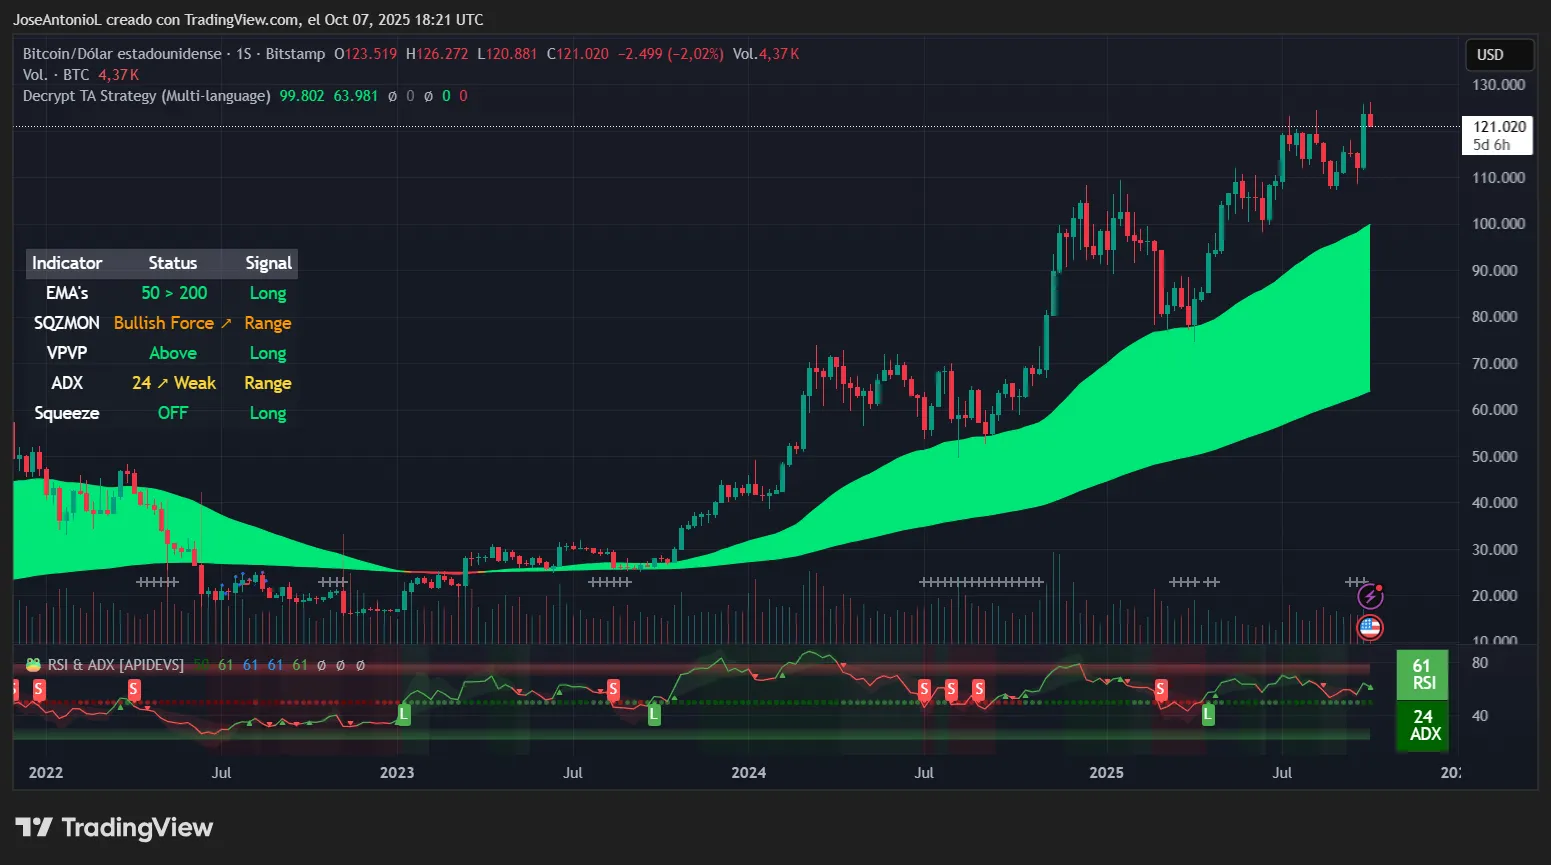
From a moving average perspective, Bitcoin is trading comfortably above both its 50-day and 200-day exponential moving averages, or EMAs. The 50-week EMA is trending higher around the $100,000 zone, while the 200-day EMA sits much lower near $65,000. When the 50-week EMA trades above the 200-week it typically signals a longer-term uptrend remains intact. This configuration provides Bitcoin with a robust safety net; even if short-term momentum falters, the overall bull structure stays healthy as long as the coin doesn't collapse below that 200-day line. (It’s worth noting that trend changes are spotted on shorter timeframes before they reflect on long timeframes).
But the Average Directional Index, or ADX, paints a more nuanced picture. ADX measures the strength of a trend regardless of direction, with readings above 25 confirming a powerful trend is underway. Currently, Bitcoin's ADX is hovering just around that limit—barely scraping into "trending" territory with 24 points in the weekly setup. This suggests that while the move higher has been sharp, conviction may be waning. Traders typically view ADX readings between 20-25 as borderline, where false breakouts become more common. Think of it like a car with the engine running hot—you're moving fast, but you might need to ease off the gas soon.
Also, consider that, historically, Bitcoin has shown a pattern of going three years in green, one year in horrible, merciless, red. So bulls may be starting to show more signs of exhaustion as 2025 nears its end.
The Relative Strength Index, or RSI, sits around 61, which places Bitcoin in the upper-neutral zone. RSI measures momentum on a scale of 0-100, with readings above 70 considered overbought and below 30 oversold. At 61, Bitcoin isn't technically overbought yet, but it's knocking on the door. This is a critical juncture: If buying momentum continues and RSI pushes above 70, it could trigger profit-taking from traders looking to lock in gains. Conversely, if it holds just below 70, there's still room to run toward that psychological $130,000 level analysts are eyeing.
Another signal to follow is the Squeeze Momentum Indicator (the little gray plus signs that appear below the price chart above). When markets are in squeeze mode, assets usually trade in a compression zone before exploding either up or down. This is the third week of the squeeze, so bulls will no doubt be praying the explosion is favorable, because if it isn’t, a correction could take the price of BTC back near $100K.
Fundamental drivers: Why institutions are piling in
The technical setup is only half the story. Fundamental factors are providing rocket fuel for this Uptober rally.
First, institutional adoption appears to have reached critical mass. The total amount of crypto assets under management by institutions reached a new all-time high as investor interest in the crypto ecosystem gains. Exchange-traded products and other investment vehicles have transformed crypto from a speculative fringe asset into a legitimate portfolio allocation for pension funds, family offices, and wealth managers. The mere existence of ETF inflows creates a self-reinforcing cycle: more buying pressure pushes prices higher, which attracts more institutional interest, which creates more buying pressure.
Second, the U.S. government shutdown that began October 1 could be bullish for crypto. While Wall Street frets about fiscal chaos, crypto investors see validation for Bitcoin's "digital gold" narrative. The shutdown highlights sovereign debt concerns and political dysfunction, driving investors toward assets that exist outside traditional financial systems. Gold has also rallied during this period, but Bitcoin's gains have outpaced the yellow metal since the shutdown.
Third, macroeconomic conditions remain supportive. Markets are pricing in potential Federal Reserve interest rate cuts later this month, which would lower the opportunity cost of holding non-yielding assets like Bitcoin. After a period of aggressive rate hikes that weighed on crypto throughout 2022-2023, the easing cycle appears to be resuming. JP Morgan analysts have projected Bitcoin could reach $165,000 by year-end 2025, while Standard Chartered maintains a bold $200,000 target.
Fourth, regulatory clarity continues to improve. The passage of comprehensive crypto legislation in the U.S. and the implementation of the Markets in Crypto-Assets (MiCA) framework in Europe have reduced regulatory uncertainty, even if compliance burdens have increased. Institutional investors crave clear rules—they can work within strict regulations, but they can't tolerate ambiguity.
The altcoin question: Is this a solo Bitcoin rally?
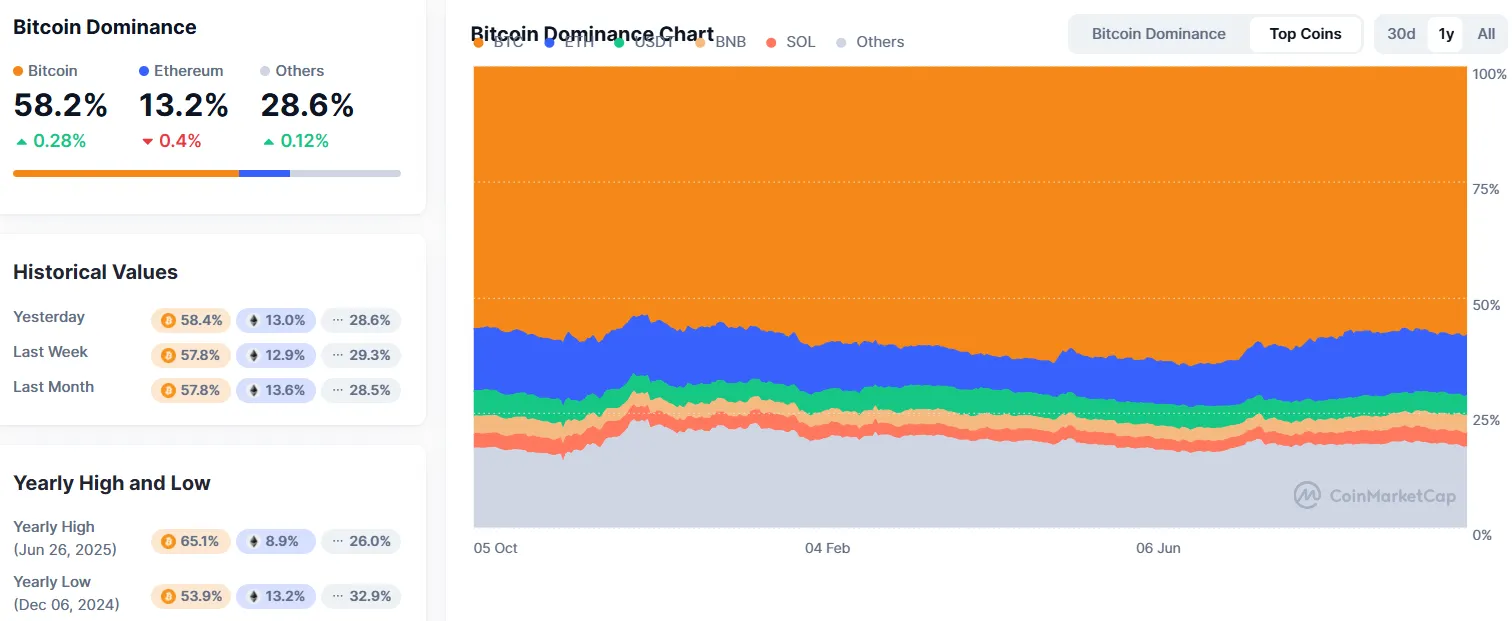
One revealing aspect of this rally is its distribution. Bitcoin dominance—its share of total crypto market cap—has been climbing, recently pushing above 58%. In other words, the rally is being led by Bitcoin rather than altcoins, which typically indicates institutional rather than retail participation. Institutions overwhelmingly prefer Bitcoin's liquidity and regulatory clarity over smaller tokens—even if that is beginning to change.
That said, Ethereum and major altcoins are participating. Ethereum's price increases match or exceed Bitcoin's gains on certain days. DeFi tokens have also shown strength, with protocols on Ethereum, Solana, and Avalanche seeing increased activity. BNB, Binance Chain’s native token, is also up this week alongside Aster and PancakeSwap, its two flagship projects.
Another altcoin sector to watch closely is AI-related tokens. With over $35 billion invested in AI-crypto integrations according to Coinmarketcap, tokens that provide data analytics, automated trading, and DeFi operations are attracting serious capital. This is one area where retail enthusiasm intersects with genuine technological innovation.
However, it is important to remember where we are. This is crypto. Historically, Bitcoin-led rallies can continue for weeks before altcoins explode higher in a euphoric "alt season." That phase tends to mark the final stage of bull markets before major—and when we say major, we mean major—corrections. We're not there yet, but it's something to monitor.
Risk factors: What could derail Uptober?
No rally is without risks, and several factors could throw cold water on the party.
Regulatory uncertainty remains despite recent progress. The U.S. Securities and Exchange Commission continues to scrutinize certain tokens and DeFi protocols. It may seem unlikely now, considering President Trump’s pro crypto stance, but a high-profile enforcement action could trigger sudden volatility. Similarly, geopolitical tensions—trade wars, conflicts, sanctions, and tariffs—could limit market access or trigger risk-off sentiment that pushes investors back toward cash.
Macro factors could shift quickly. If inflation data comes in hotter than expected, the Federal Reserve might delay rate cuts, strengthening the dollar and pressuring risk assets including crypto. Conversely, if economic data deteriorates sharply, the risk-off rotation could overwhelm crypto's safe-haven narrative.
Finally, technical resistance levels matter. Bitcoin faces formidable resistance every time it enters price discovery territory. If buyers can't push through convincingly, a "double top" pattern could form, inviting significant profit-taking. Ethereum's $4,600-$4,700 zone represents a similar make-or-break level.
What to expect for the rest of October
Based on historical patterns and current conditions, several scenarios appear plausible.
Bullish scenario: Bitcoin consolidates briefly between $122,000-$126,000 before pushing toward $130,000-$135,000 by mid-to-late October. Ethereum and the rest of the altcoins follow as usual with more intensity. ETF inflows remain robust, ADX readings strengthen above 30 confirming powerful trends, and altcoins begin catching up in a broad-based rally. This would align with Uptober's historical pattern and current fundamental drivers.
Neutral scenario: Bitcoin and Ethereum trade sideways in wide ranges—BTC between $118,000-$126,000, ETH between $3,800-$4,500—as investors digest rapid gains. ADX readings remain weak, indicating choppy, directionless trading. Volume tapers off as retail traders await clearer direction. This consolidation phase would actually be healthy, setting up for another leg higher in November.
Bearish scenario: Bitcoin fails to hold $122,000 support and retraces toward $118,000-$114,000. Ethereum drops back below $3,800. Profit-taking accelerates as overbought RSI readings trigger algorithmic selling. A negative macro catalyst—disappointing economic data, escalating geopolitical tensions, or a security breach—could accelerate the decline. However, as long as major support zones hold, the broader bull structure would remain intact.
The most likely outcome sits between bullish and neutral: continued gains but at a slower, more sustainable pace. Explosive moves are not sustainable—markets need to breathe. Expect periods of consolidation punctuated by attempts at higher highs.
Smart money should watch for daily closes above $126,000 with rising ADX as confirmation of continued bullish momentum. Conversely, daily closes below $122,000 with declining volume would suggest the rally is running out of steam.
Uptober has delivered so far, but the month is just beginning. With institutional flows running hot, technical indicators showing room to run, and historical seasonality on crypto's side, the setup favors bulls. But volatility is crypto's constant companion—risk management and realistic expectations remain essential even during the most bullish months.
Disclaimer
The views and opinions expressed by the author are for informational purposes only and do not constitute financial, investment, or other advice.