
In brief
- Bitcoin trading at $115,542, nearly 1% above the critical $114,200 monthly open level.
- Technical indicators show bullish momentum after a major correction earlier this month.
- Sentiment on prediction markets remains strong, but the upcoming Fed meeting and trade talks with China could swing things in either direction.
It’s been an up and down month of October for Bitcoin traders and investors, despite the seasonal promise of "Uptober" gains.
Historically, October has been good for Bitcoin holders, posting a green month 10 out of the last 12 years and delivering average gains of more than 20%. At the moment, Bitcoin stands at a relatively meager +1.14% for the month, according to data from Coinglass.
Bitcoin spiked above $123,000 in early October before plummeting to $107,000 mid-month—a 13% correction that wiped out weeks of gains in a matter of days. Since then, bulls have been grinding back, recovering to current levels around $115,000.
Currently trading at $115,542, Bitcoin has managed to hold above this critical threshold despite choppy price action throughout October. The question now facing traders: Will Uptober live up to its name and see Bitcoin finish in the green?
Traditional markets are firing on all cylinders, with the S&P 500 hitting fresh record highs above 6,900 points on Tuesday. Investors are pricing in a potential quarter-point rate cut when the Federal Reserve announces its decision Wednesday, which would bring rates down to the 3.75%-4.00% range—typically bullish territory for risk assets like crypto.
Adding fuel to the rally, Treasury Secretary Scott Bessent hinted at a framework for resolving U.S.-China trade tensions ahead of a meeting between Presidents Donald Trump and Xi Jinping next week. This combination of dovish monetary policy and easing geopolitical risks has propelled the risk-on sentiment that crypto markets typically track.
Perhaps most tellingly for Bitcoin's immediate prospects: spot Bitcoin ETFs recorded their third consecutive day of inflows, pulling in $149 million as of yesterday.
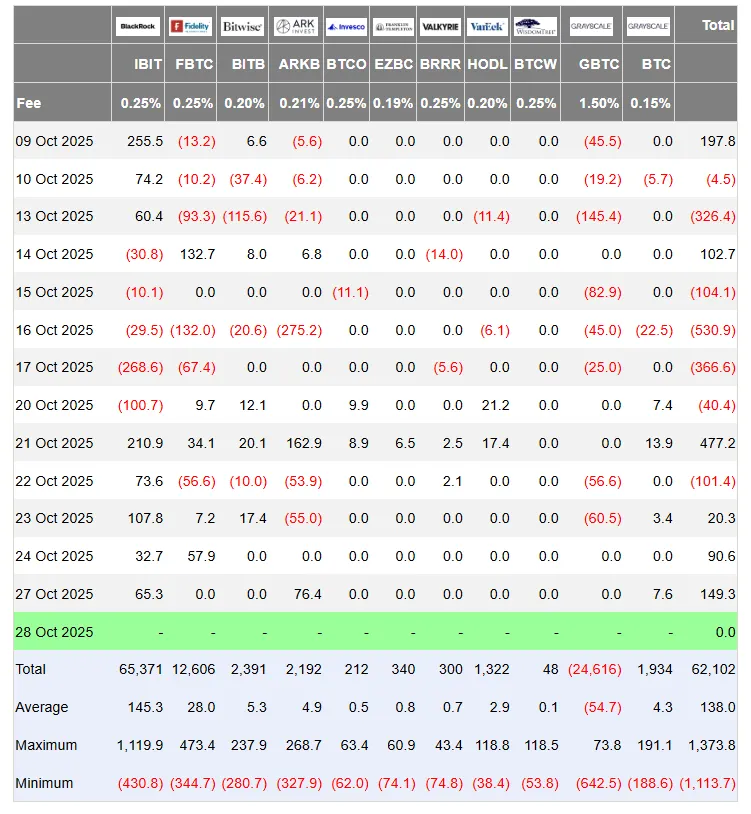
When institutional money flows into Bitcoin through regulated products, it typically signals conviction from larger players—the kind of demand that supports price stability.
Bitcoin technical breakdown: Bulls building strength
So, will Bitcoin end the month in the green or red?
Since the time window for our forecast is short, we used the four-hour candlestick setup for our analysis.
The short-term chart shows a bullish structure that suggests Bitcoin is more likely to hold—and potentially extend—its gains above $114,200 than to break below it. At least in the immediate future, prices seem to have broken past the resistance line that marked the correction (the dotted red line in the chart below) and bounced back up in an ascending channel (the dotted green lines in the chart).
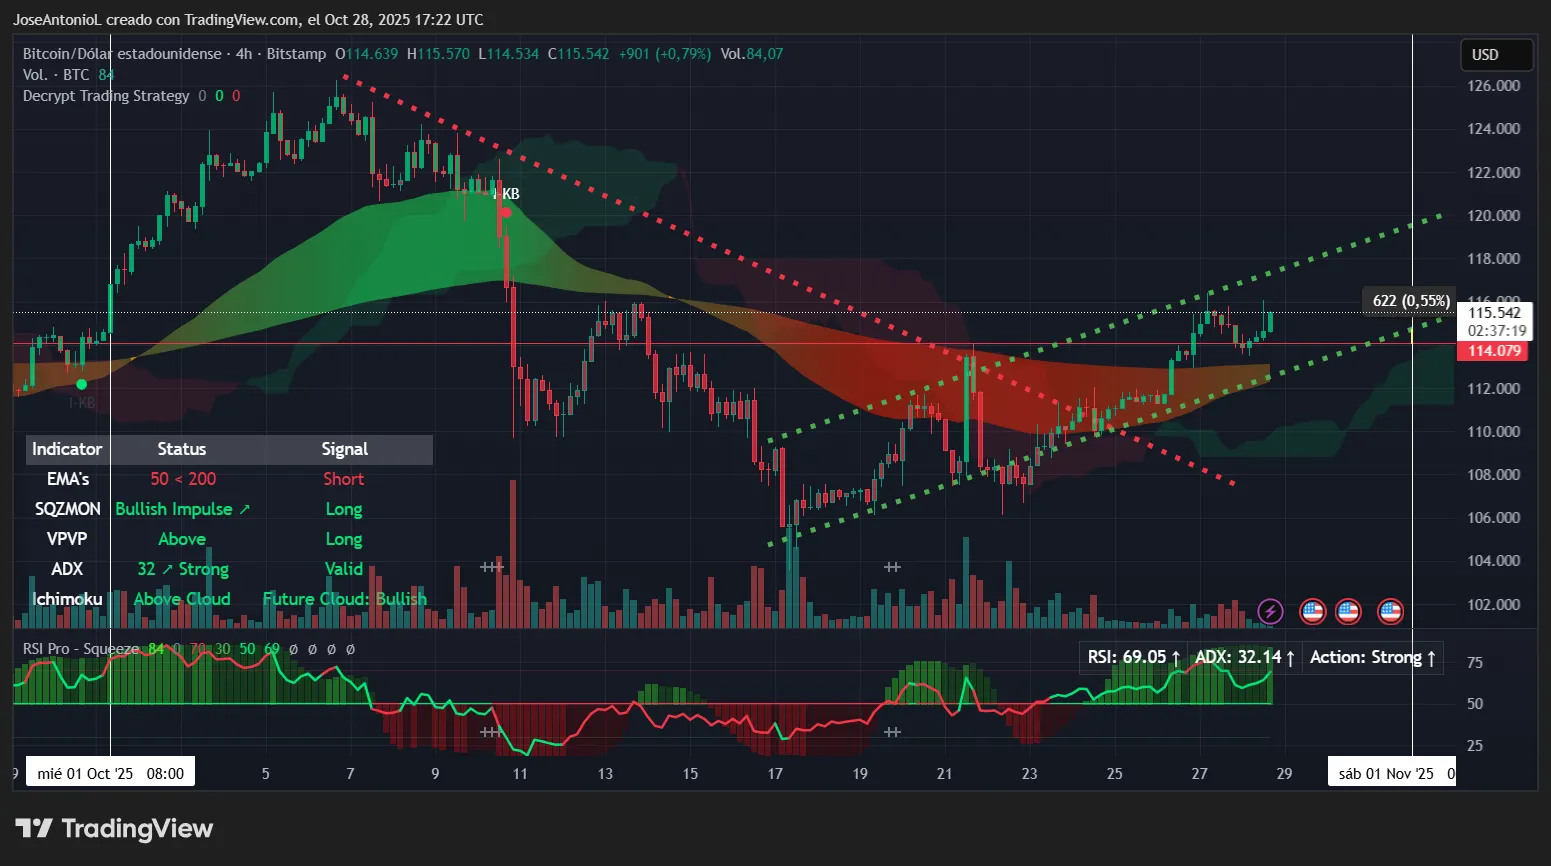
The Average Directional Index, or ADX, sits at 32.14, marked as "strong" on the chart. This indicator measures trend strength, regardless of direction, on a scale from 0 to 100. Readings above 25 confirm an established trend, and anything above 30 suggests powerful momentum. When ADX crosses above 25 and keeps climbing, it typically signals that the trend has legs and is likely to persist rather than quickly reverse.
The Relative Strength Index, or RSI, at 69.05 tells an interesting story. RSI measures momentum by comparing the magnitude of recent gains to recent losses, with readings above 70 indicating overbought conditions where profit-taking often emerges. At 69, Bitcoin is approaching that zone but hasn't quite reached it—so it has room to run in the next three days, before another reaching overbought territory, triggering a correction on algorithmic trading setups.
Exponential Moving Averages, EMAs, tell traders where price supports and resistances are by taking the average price of an asset over the short, medium, and longer term. With Bitcoin, the 50-period EMA (the average price over the last 50 four-hour trading sessions) is below the 200-period EMA, generating a "short" signal in the four-hour timeframe.
This configuration—sometimes called a "death cross" when it occurs—typically signals bearish market structure, as it means short-term prices are averaging below long-term prices. However, current price action is trading well above both moving averages, with the EMA 50 moving upwards signaling a potential golden cross (crossing above the EMA 200 for a bullish setup).
The Squeeze Momentum Indicator is flashing "bullish Impulse" with a "long" signal. This indicator, developed by trader John Carter, identifies periods when volatility compresses (like a spring being squeezed) before explosive moves. When the squeeze "fires" with bullish momentum, it signals that the compression phase has ended and directional movement is beginning. The "bullish Impulse" status means not only has the squeeze fired, but momentum is accelerating to the upside. Traders typically interpret this as a high-probability setup for continued gains, especially when combined with other confirming indicators like rising ADX.
Finally, the Ichimoku Cloud analysis shows Bitcoin is trading above the clouds (prices are stronger than the preceding trading sessions) with the future cloud forecasted as bullish. For traders unfamiliar with this Japanese charting technique, think of the cloud as a dynamic support/resistance zone. When price trades above a bullish-tilted cloud with expanding momentum, it typically indicates trend continuation rather than reversal.
Finally, if Bitcoin respects the current price support, even at its lowest point, it would be $622 above the opening price it registered on October 1. Just 0.5% above the target, but still more than 0.
Green is more likely
Can Bitcoin close October above $114,200? The technical evidence suggests it can. If the trend continues, this Uptober may end up as a short-bodied doji—wild price swings in between, but more or less where it started. In other words, it may end up being a small gain, but still positive.
With BTC currently trading 1.2% above that level and showing strong trend confirmation across multiple indicators, the path of least resistance appears to be sideways to higher rather than a breakdown below monthly open prices.
The immediate support zone sits around $114,000-$114,500, which aligns with the monthly open and recent consolidation areas. For Bitcoin to close October in the red, it would need to break through this support zone and hold below it for the remaining days of the month—a scenario that seems unlikely given the current ADX reading, bullish momentum indicators, and supportive macro backdrop.
At the moment, sentiment also remains broadly bullish, with traders on Myriad—a prediction market developed by Decrypt's parent company Dastan—pricing in a 70% chance that Bitcoin continues upwards towards $120K before falling back down to $100K. Those odds now look quite different than they did six days ago, when traders were predicting a 56% chance Bitcoin would fall to $100K.
However, traders should remain aware that the Fed's policy announcement on Wednesday represents a binary risk event. While markets are pricing in a 25 basis point cut, any hawkish language about future rate path could trigger short-term volatility. The key will be whether Bitcoin can maintain support above $114,000 during any Fed-related turbulence.
Key levels to watch:
- Immediate support at $114,000-$114,500 (monthly open zone),
- Strong support at $112,000 (recent consolidation low),
- Immediate resistance at $116,000 (recent rejection point),
- Strong resistance at $118,000-$120,000 (psychological barrier and volume gap)
Disclaimer
The views and opinions expressed by the author are for informational purposes only and do not constitute financial, investment, or other advice.