

In brief
- Ethereum, Dogecoin, and XRP prices are pumping, with technical indicators mostly flashing bullish for each coin.
- The surge in altcoins has led to the crypto market surging above a record-breaking $4 trillion.
- Where do altcoins go from here? Here's what the charts say.
For crypto traders, it’s been a good week to be in XRP, Ethereum, and Dogecoin. Or just about anything else for that matter, but these three coins in particular have really stood out, given Bitcoin’s relatively modest performance over the last seven days.
What’s going on, and what do the charts suggest about XRP, ETH, and DOGE going forward? Let’s dive in:
The cryptocurrency market is experiencing one of its most explosive rallies since 2021, with total market capitalization surging above $4 trillion once again for only the second time ever, after briefly touching this milestone last week. It comes as Bitcoin shattered its previous all-time high, reaching $122,838 on July 14, igniting heavy bullish sentiment among crypto permabulls.
The broader macroeconomic picture is also looking optimistic for investors. The S&P 500 keeps flirting with 6,000 points while oil prices remain relatively stable around $76 per barrel despite ongoing Middle East tensions. More importantly, the passage and signing of the GENIUS Act, which establishes a regulatory framework for stablecoins in the United States, is seen as a step in the right direction for institutional investors who have been craving for regulatory clarity for years.
This perfect storm of favorable conditions has ignited a new Alt Season, with its own Index surging to 59 points, just 2 points below the yearly high registered on January 30.
Ethereum (ETH): The king of altcoins is back
Ethereum has emerged as the star performer among major cryptocurrencies, posting an impressive 25.7% gain over the past week to reach $3,843 before correcting to its current levels around $3769. This surge seems to be backed by serious institutional muscle, with spot ETH ETFs attracting $2.2 billion in weekly inflows.
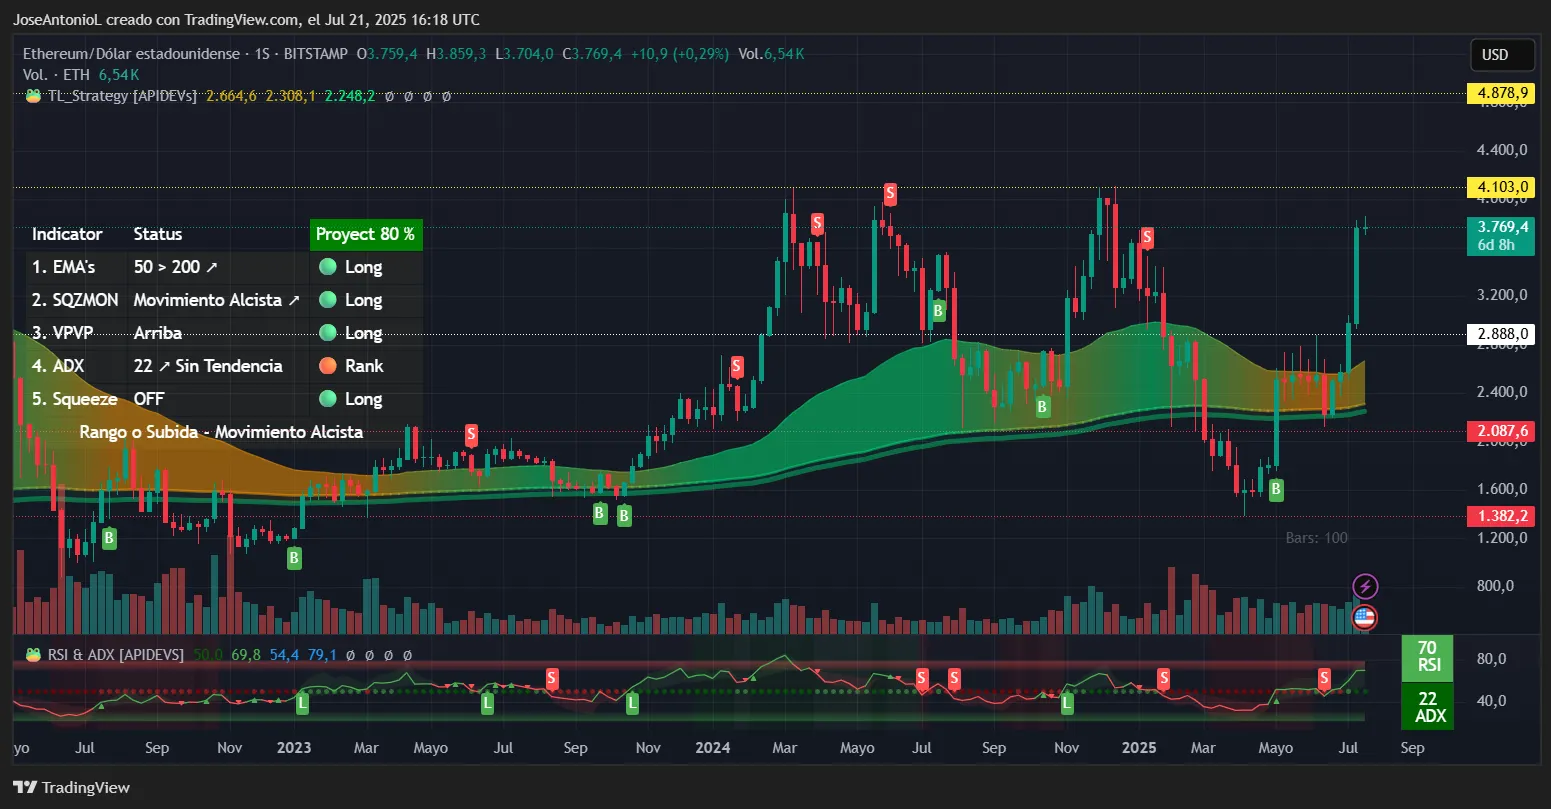
On Myriad on Linea, a prediction market developed by Decrypt’s parent company Dastan on the Ethereum layer-two network Linea, predictors are not overly bullish in the short term. Myriad users place the odds at just 40% that Ethereum breaks past the psychological resistance of $4K per coin by July 25.
Conversely, Myriad traders are more certain than not, placing the odds at 63%, that Ethereum hits a new all-time high (above $4,891) before the end of the year.
The technical picture for Ethereum is interesting. The Relative Strength Index, or RSI, sits at a red-hot 70, indicating extreme bullish momentum. Think of RSI as a speedometer for price momentum—when it's this high, it means buyers are stepping on the gas pedal hard. While RSI readings above 70 typically signal overbought conditions that might concern day traders, in the context of a major breakout, this actually confirms genuine buying pressure rather than mere speculation.
Considering the high readings, traders might consider setting up stop loss levels near current prices, to avoid possible mass liquidations, while still gaining exposure to possible bullish pressure considering the majority of the indicators point towards a greener future for the coin.
The Average Directional Index, or ADX, at 22 is approaching the crucial 25 threshold. ADX measures trend strength regardless of direction. An ADX below 20 indicates no clear trend while readings above 25 confirm a strong directional move is underway. For Ethereum, this suggests we're on the verge of a sustained rally rather than a flash in the pan.
It also points to a trend not being strong enough to prevent a small correction. This may happen without affecting the overall bullish movement.
Most importantly, Ethereum's price action relative to its Exponential Moving Averages tells a bullish story. Moving averages take the average price of an asset over a given period of time. And ETH is currently trading well above both the 50-day EMA ($2,888) and the 200-day EMA (lower). The expanding gap between these averages—known as moving average divergence—typically precedes multi-month trending moves. When short-term averages pull away from long-term ones like this, it's like a rubber band stretching before a powerful snap higher.
The Squeeze Momentum Indicator—which measures whether markets are in periods of contraction before massive movements—has also fired bullish, suggesting that after a period of consolidation, volatility is expanding in the bulls' favor.
Key Levels:
- Immediate support: $3,417 (Fibonacci 23.6% retracement)
- Strong support: $2,888 (50-day EMA)
- Immediate resistance: $4,103 (visible on chart)
- Strong resistance: $4,282 (127.2% Fibonacci extension)
XRP: The king of bank coins is back
XRP's 20.9% weekly surge to $3.52 is a complete redemption arc for a cryptocurrency that's been trapped in regulatory purgatory since 2018. The token finally broke above its previous all-time high of $3.40, entering true price discovery mode for the first time in seven years.
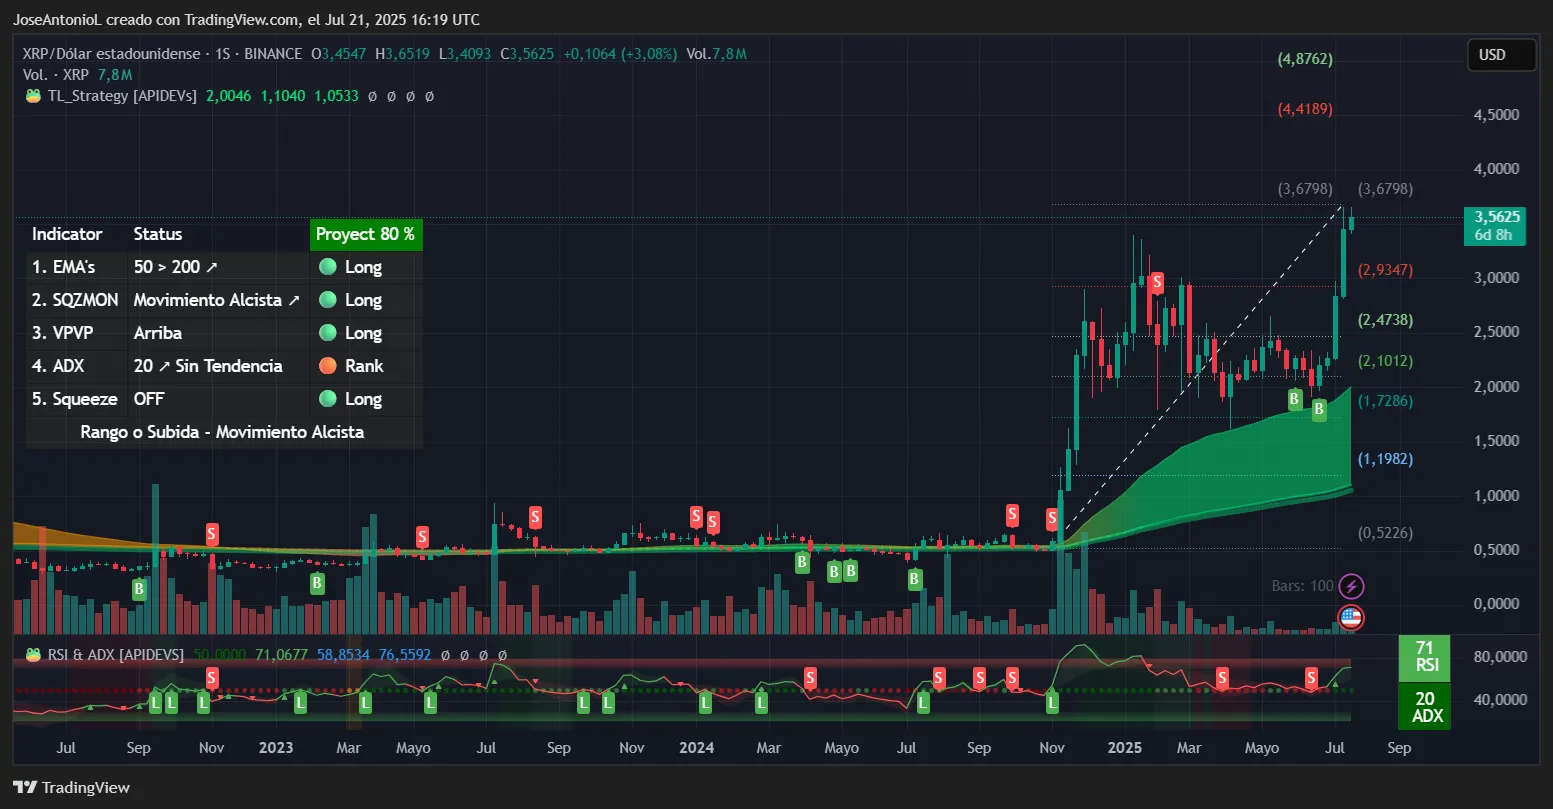
The technical setup for XRP is fascinating. The weekly charts look like something unnatural for a serious investment: flat for years, then a parabolic explosion out of nowhere. But that's the nature of crypto
The RSI at 71 on the weekly chart sits right at the overbought threshold, but context is crucial here. After years of sideways action, such readings may mark the beginning of a trend rather than its end. It's like a coiled spring finally releasing—the initial burst might seem extreme, but there's years of pent-up energy behind it.
The ADX reading of 20 might seem weak compared to other indicators, but for XRP, this actually makes sense. After trading sideways for so long, trend strength indicators naturally reset to low levels, making it hard to overcome in months what has been the standard for more than half a decade. The fact that it's climbing toward 25 suggests a new trend is just beginning to establish itself.
XRP's moving average configuration provides the most bullish signal. The 50-week EMA sits well below current levels, and the gap to the 200-week EMA continues to expand. On weekly timeframes, this widening differential typically precedes multi-month trending moves, as it reflects sustained accumulation by long-term holders rather than short-term speculation.
Key Levels:
- Immediate support: $2.93 (previous resistance turned support)
- Strong support: $2.47
- Immediate resistance: $3.68 (recent high)
- Strong resistance: $4.4-$ (Fibonacci extension targets—theoretical natural targets that could form during price trends)
Dogecoin (DOGE): The king of meme coins is back
Dogecoin's 33.5% weekly explosion to $0.274 made it the best performing meme coin in the top 100 after Floki. The meme coin is undergoing a fundamental transformation, highlighted by Nasdaq-listed Bit Origin's announcement of a $500 million DOGE treasury strategy, with an initial $40.5 million purchase already completed.
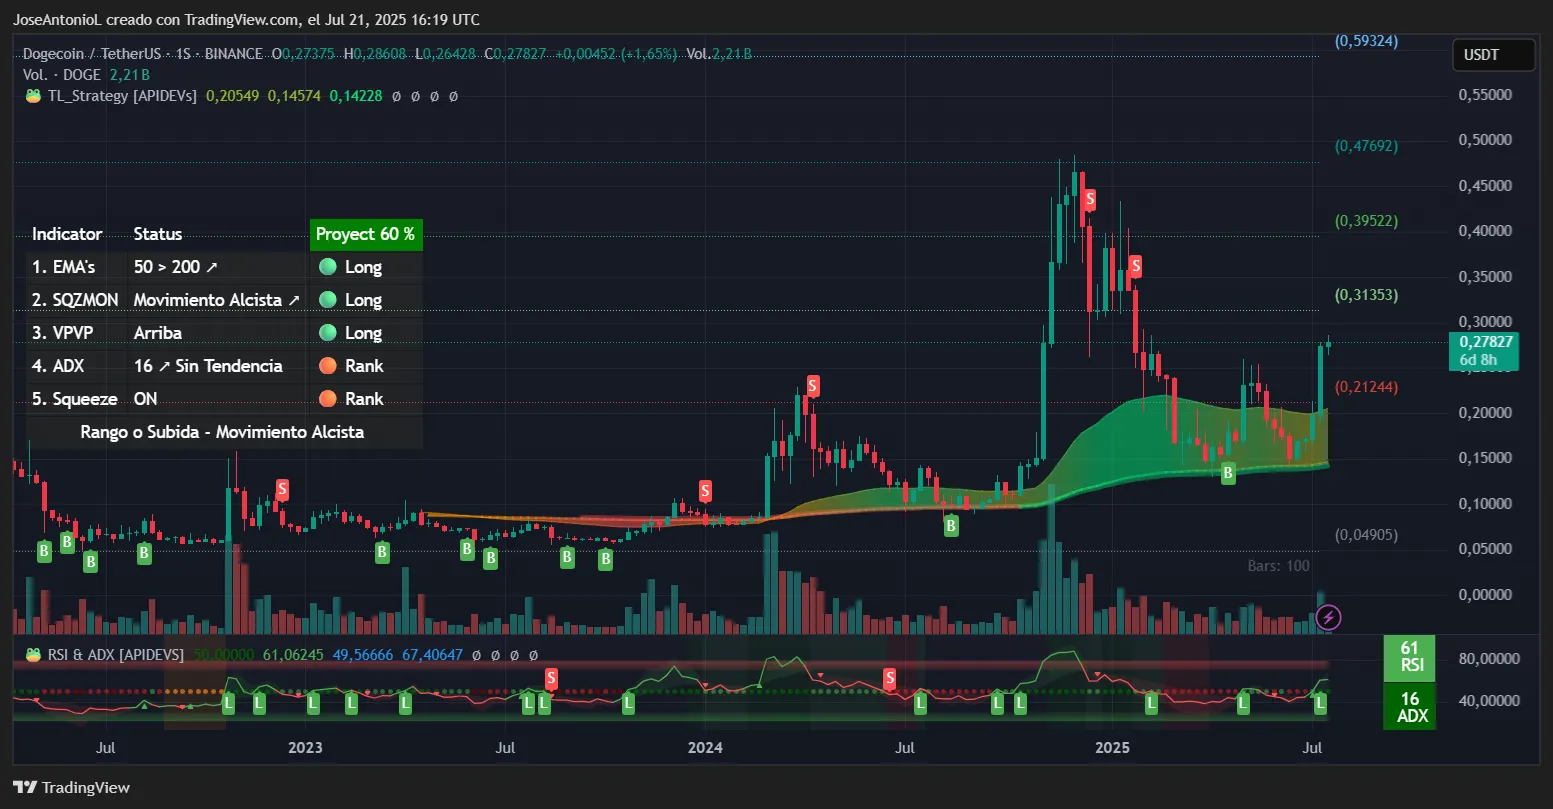
The technical indicators for DOGE are also showing bullish momentum. The RSI at 61 shows strong buying pressure without being overextended—it's in what traders call the "sweet spot" where trends can run for extended periods.
The ADX at 16 means the bullish spike is actually a weak movement, but remember that DOGE was stuck in a prolonged downtrend. Low ADX readings after a strong move often indicate consolidation before the next leg higher. If you’re a DOGE trader, it might be a good idea to monitor this indicator in the upcoming days for more accurate readings.
What's particularly interesting is the Squeeze Momentum Indicator showing "on" status, indicating that volatility is compressed and ready to expand. This may point to bulls failing to keep up after reaching a price resistance, but with DOGE successfully breaking past a double bottom (an usually bullish pattern in which prices bounce twice in a resistance, and the 200-period EMA forming a “W” shape), conventional wisdom here suggests it should struggle but maintain its course for a few more weeks at least.
The 50-day EMA around $0.20 now acts as immediate support, with the 200-day EMA providing a floor near $0.15. The fact that DOGE is trading above both with expanding distance between them confirms the bullish market structure.
Key Levels:
- Immediate support: $0.21 (psychological level and short term EMA zone)
- Immediate resistance: $0.28-$0.30 (2025 highs)
Disclaimer
The views and opinions expressed by the author are for informational purposes only and do not constitute financial, investment, or other advice.