

In brief
- Bitcoin set a new all-time high last week above $122,000.
- But BTC has since struggled to hold onto those gains, now trading below $120K.
- Can bulls make up the ground? Predictions on Myriad lean slightly bearish at the moment on the short-term outlook.
Bitcoin is on a historic run, setting a new all-time high above $122,000 just last week. Can Bitcoin bulls keep the momentum going?
At the moment, Bitcoin sits just below $120,000, and the question before traders on the Myriad prediction market is: Can Bitcoin hold above $120,000 by the end of the week?
On Myriad, a prediction market developed by Decrypt’s parent company Dastan, traders are almost evenly split, but lean slightly bearish, placing the odds at just 47% that BTC holds above the psychologically significant price threshold.
Do the price charts agree? Let’s dive into the technicals:
Bitcoin's $120K price target: Bulls face critical test
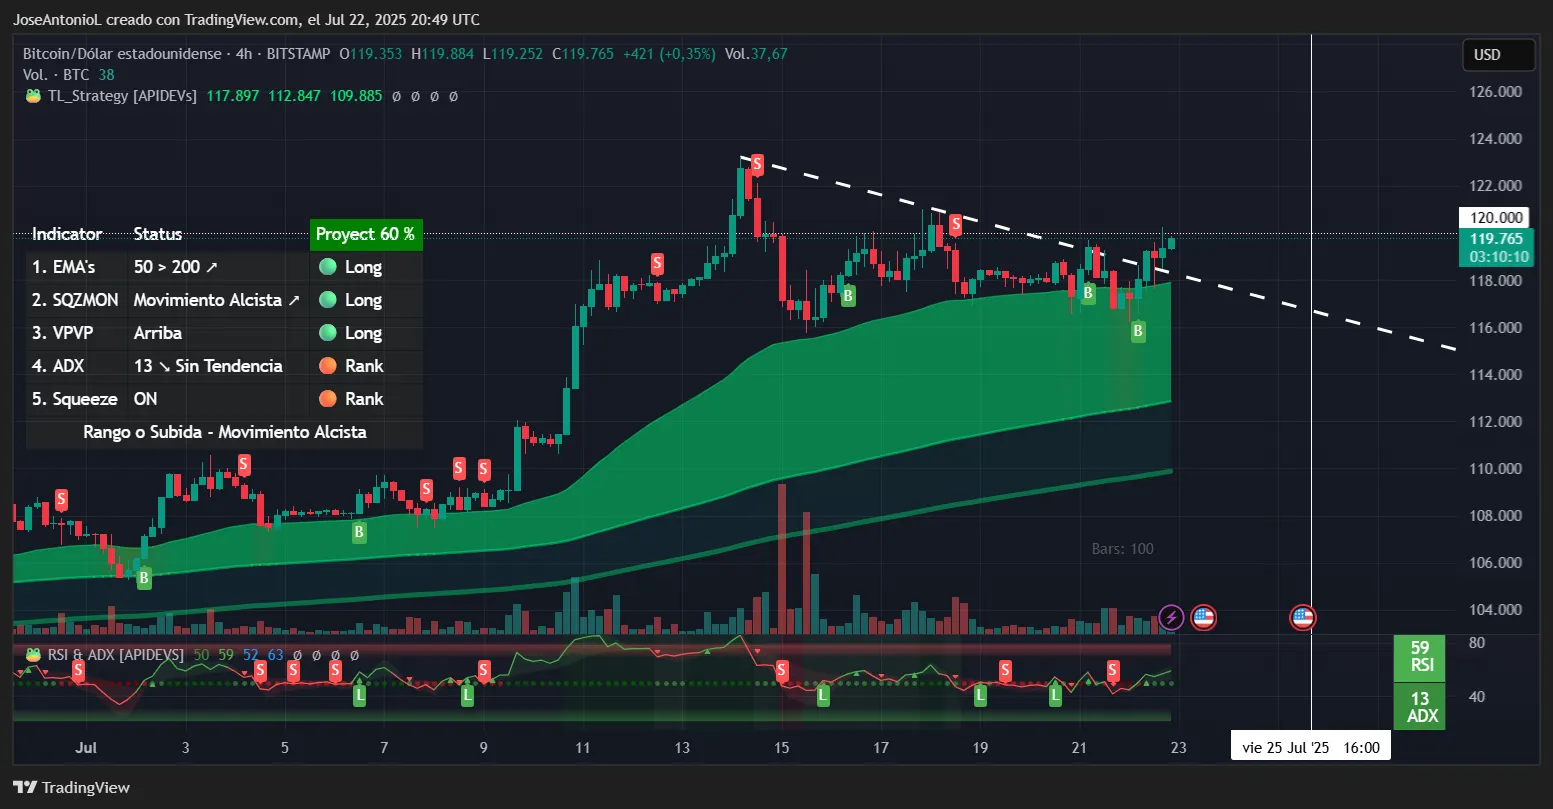
Bitcoin is currently trading at $119,765, sitting right at a descending trend line that has capped prices since the July 14 all-time high. The technical setup presents a classic inflection point that could determine whether BTC closes above $120,000 by July 25.
The odds on Myriad have flipped multiple times today, but at the moment slightly favor the bears.
The Squeeze Momentum Indicator, a metric traders who enjoy technical analysis often study, shows Bitcoin is going through a price compression face on the 4-hour candlestick charts. This indicator measures when volatility compression is about to release into directional movement. When combined with the squeeze status showing "on," it tends to precede explosive moves once the phase ends.
Right now, the coin seems to be trading sideways—and has more or less been doing so for the last week after breaking its all-time high. It broke past a small resistance that was pushing prices down, but it is still too early to call it a bullish breakout. That $120K price point has proven to be a high hurdle for Bitcoin to clear.
The Average Directional Index, or ADX, reads 13, indicating weakening of the previous bullish jump. ADX measures how strong a price trend is regardless of direction. ADX readings below 20 suggest no clear trend, while readings above 25 confirm a trend has been established. A low reading is generally concerning for bulls, since price breakouts without ADX support above 20 often result in false moves.
The 50-day Exponential Moving Average (the green ribbon in the chart above) sits around $116,000 with the 200-day EMA below, creating what traders would interpret as a bullish pattern. When price trades in the upper half of this ribbon with the 50-day EMA above the 200-day EMA, it indicates medium-term bullish structure.
The Relative Strength Index, or RSI, at 59 shows mild bullish momentum without being overbought. The Relative Strength Index measures the speed and magnitude of price changes. RSI readings above 70 indicate overbought conditions that often precede pullbacks while readings below 30 suggest oversold levels.
Based on the technical setup, it’s more likely than not that Bitcoin closes the week above $120,000, but of course things can always change.
For traders who study charts, though, the anemic ADX and declining trading volume on the way up present risks of rejection, meaning selling pressure could once again get triggered around the big, round number.
Key Levels on the immediate timeframe:
- Immediate resistance: $120,000 (psychological level and prediction market target)
- Strong resistance: $122,838 (recent all-time high)
- Immediate support: $117,500 (Volume Profile Point of Control)
Disclaimer
The views and opinions expressed by the author are for informational purposes only and do not constitute financial, investment, or other advice.