

In brief
- Bitcoin, Ethereum and XRP prices are holding relatively steady as the market rolls into Red September.
- September is historically the worst month of the year for markets, with BTC on average dropping 3.77%.
- Despite the sideways action, technical indicators suggest traders could be positioning for history to repeat.
The cryptocurrency market is attempting to shake off the weekend blues as September begins, but history suggests this could be just the calm before the storm.
Market sentiment has plummeted, according to the Crypto Fear and Greed Index. Sentiment has exited neutral territory and dropped into the “fear” zone, falling from 75 out of 100 in mid-August to 46 today—the worst score since mid-June.
This shift in sentiment comes as traders brace for what's historically been crypto's cruelest month: “Red Septmber.” Bitcoin has dropped an average of 3.77% in price each September since 2013.
The broader macroeconomic picture adds another layer of complexity. The Federal Reserve's September 16-17 policy meeting may well be one of the most contentious in years. With markets implying an 87% chance of a 0.25% cut, the crypto market finds itself at a crossroads between seasonal weakness and potential monetary policy relief.
Meanwhile, traditional markets are showing mixed signals, with the S&P 500 futures pointing to a positive open on Tuesday after Friday's volatility, while inflation remains above the Fed's target with core CPI at 3.1%.
But while the stock market is on holiday in the United States, crypto—of course—never rests. Here’s what the Bitcoin charts are showing today:
Bitcoin (BTC) price: Testing critical support
Bitcoin is showing resilience with a modest 0.53% gain to $108,842, recovering from an intraday low of $107,270. The flagship cryptocurrency has been bounced around into its current range (the white dotted line in the chart below), suggesting buyers are defending the psychologically important $108,000 level.
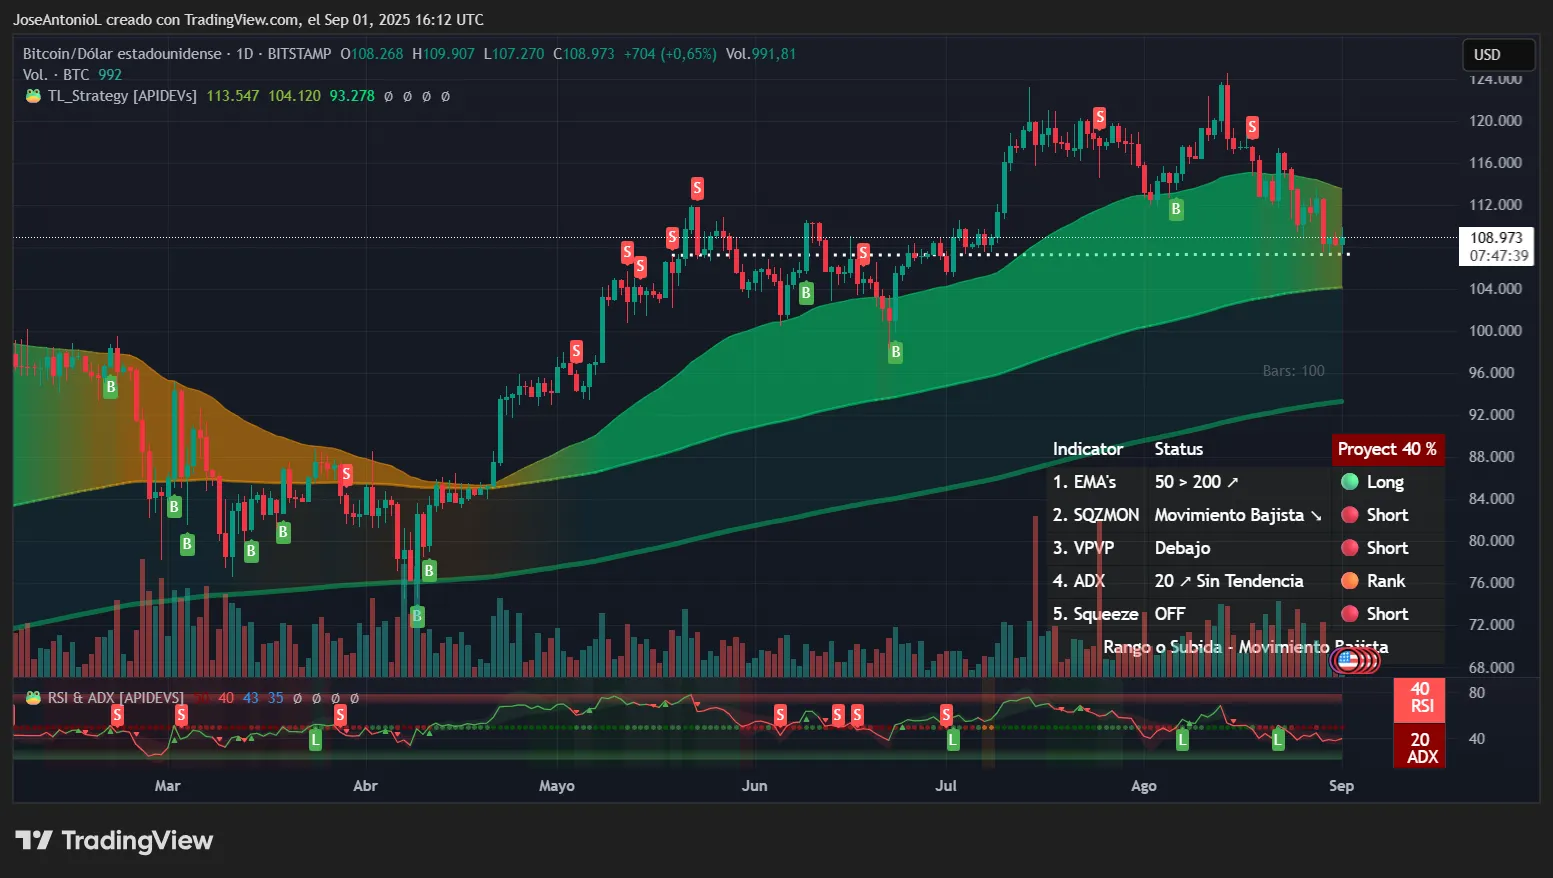
Bitcoin’s Average Directional Index, or ADX, currently stands at 20, indicating no clear trend at the comment. ADX measures trend strength on a scale from 0-100, where readings below 25 suggest choppy, directionless tradings.
In this case, Bitcoin’s score of 20 suggests its inability to move further up to new all-time highs or further down towards a death cross for now. For traders, this means Bitcoin is currently in a consolidation phase where range-trading strategies might outperform trend-following approaches.
The Relative Strength Index at 40 points shows that the Red September effect is real: Traders are starting to sell their coins faster than usual. The Relative Strength Index, or RSI, measures market momentum on a scale from 0 to 100, where readings above 70 indicate overbought conditions and under 30 suggest oversold.
Right now Bitcoin is approaching oversold territory, with more people interested in getting rid of their coins than in buying them.
The Squeeze Momentum Indicator shows "off" status, signaling that volatility has already been released rather than building up. This indicator identifies when markets compress before explosive moves. When it's "off," it suggests the recent price action has already exhausted near-term volatility. The reading shows there is bearish movement, and that selling pressure remains dominant despite today's modest recovery.
Exponential moving averages, or EMAs, provide traders with a glimpse of price resistances and supports by taking the average price of an asset over short and longer time frames. Bitcoin’s EMA configuration remains bullish, with the 50-day EMA above the 200-day EMA
But current price action hovering near these averages suggests a battle between bulls and bears. It’s also worth noting that the gap between the two EMAs is starting to close. That’s not a good sign as it shows a deceleration of the bullish trend and could potentially lead the coin into a death cross configuration which, for traders, would confirm a solid bearish trend instead of just a correction.
On Myriad, a prediction market developed by Decrypt's parent company Dastan, traders are feeling the bearish vibes. Myriad users now give Bitcoin a 75% chance of dropping to $105,000 sooner than later. A little over two weeks ago, the Myriad market had placed the odds of Bitcoin soaring to $125,000 at over 90%.
Key Levels:
- Immediate support: $105,000 (psychological level and potential September target)
- Immediate resistance: $113,000 (previous consolidation zone and EMA50 price line)
Ethereum (ETH) price: Bulls struggle against resistance
Ethereum is currently underperforming with a -0.66% decline to $4,363, despite opening just a bit higher at $4,392.87. The second-largest cryptocurrency briefly spiked to $4,490.97—a move of 2.2% from the open—but failed to hold gains, signaling rejection at the $4,500 resistance level.
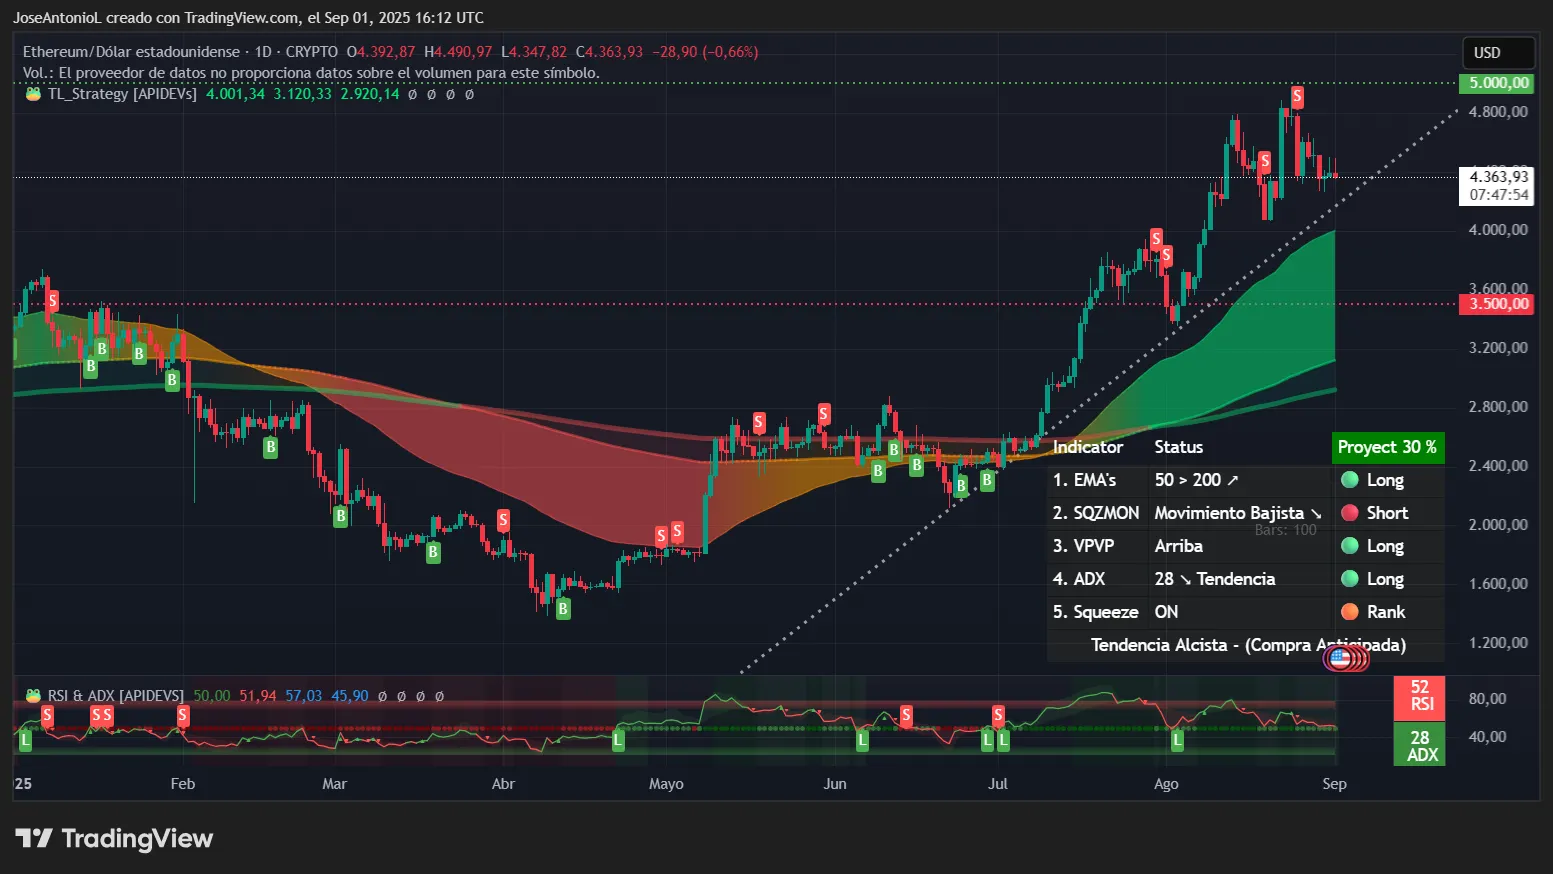
Ethereum’s ADX at 28 tells a more bullish story than Bitcoin's, crossing above the crucial 25 threshold that confirms trend establishment. This reading suggests Ethereum's recent price action represents genuine trending behavior rather than random volatility. Traders typically view ADX above 25 as validation for trend-following strategies, though the current price weakness contradicts this bullish signal—a divergence that often precedes sharp moves.
On the other hand, ETH’s ADX score has been decreasing over time, which may point to a weakening trend in the near future.
The Squeeze Momentum Indicator suggests volatility is building after a compression phase, typically preceding breakout moves. This is probably one small consequence of the September Effect, with short-term traders trying to sell their coins fast and long-term traders buying for what they expect to be the bounce ahead.
Ethereum’s RSI at 57 is also in what traders would consider bullish territory. It’s been higher recently, which suggests the market is calming down. Position traders may be holding and waiting for explosive movements before making judgements.
The bullish EMA alignment (with the 50-day average above the 200-day average) provides structural support, but the failure to maintain above $4,400 raises concerns. The current setup shows Ethereum is still very bullish—way above the average price of the past 50 days and coiling for a significant move as it breaks a weak, short symmetrical triangle pattern.
Myriad traders are holding the bullish Ethereum line as well. Predictors on the platform place the odds at 77% that ETH continues its upward trajectory and hits $5,000 before the end of the year.
Key Levels:
- Immediate support: $4,360 (intraday low)
- Strong support: $4,000 (psychological level and 50-day EMA zone)
- Immediate resistance: $4,490 (today's high)
- Strong resistance: $4,500 (key technical barrier)
XRP price: Adrift at sea
XRP rounds out the major cryptocurrencies with a -0.5% decline to $2.76, showing relative weakness. The Ripple-linked token briefly touched $2.8387—a 2.3% intraday move—before sellers took control, pushing it down to $2.70.
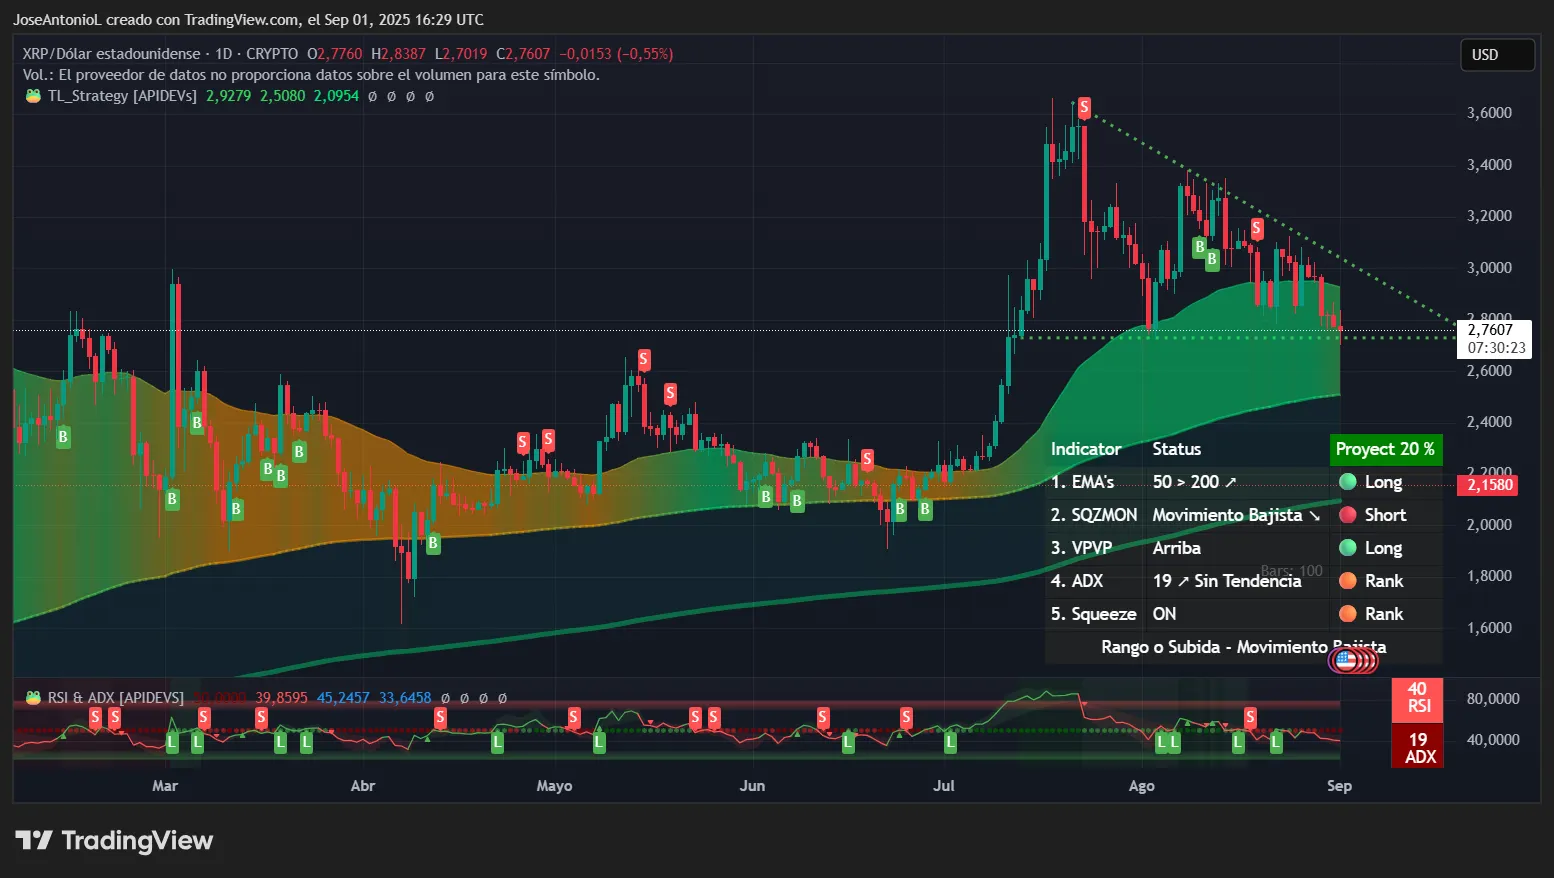
The ADX at 19 is the weakest among the three top cryptocurrencies, firmly below the 25 trend threshold. This reading indicates XRP is stuck in a range-bound market with no clear directional bias. For traders, ADX below 20 typically suggest they should avoid trend-following strategies and instead focus on support and resistance levels for range trading. A low reading like this after recent volatility often marks accumulation phases before the next trending move.
Despite the Squeeze Momentum being "on," XRP's inability to hold gains above $2.80 suggests bears remain in control. The indicator's activation combined with weak ADX creates what technical analysts call a "coiled spring" scenario. Extended periods of low ADX often lead to violent breakouts when they finally occur, though direction remains uncertain.
The price action shows a potential descending triangle pattern that might end in a bearish breakout, potentially testing the 200-day EMA support or even lower. It’s especially worth noting that XRP has now broken below the 50-day EMA support, which means bears are in control—at least in the short term.
The RSI at 40 points confirms the coin is heading into oversold territory, with sellers in control, though still not in full panic mode.
Myriad traders believe XRP drops to $2.50 before it ever reaches $4 per coin, placing those odds at 78% now.
Key Levels:
- Immediate support: $2.70 (today's low, psychological level, and the actual support of the descending triangle)
- Strong support: $2.50 (previous consolidation base and EMA200 price zone)
- Immediate resistance: $2.85 (EMA50)
- Strong resistance: $3.00 (major psychological barrier and resistance set by the descending triangle)
Disclaimer
The views and opinions expressed by the author are for informational purposes only and do not constitute financial, investment, or other advice.