






In brief
- Bitcoin trades at $83,823 on the daily chart. Technical indicators suggest a strong uptrend, but BTC’s price remains stuck below $84,433.
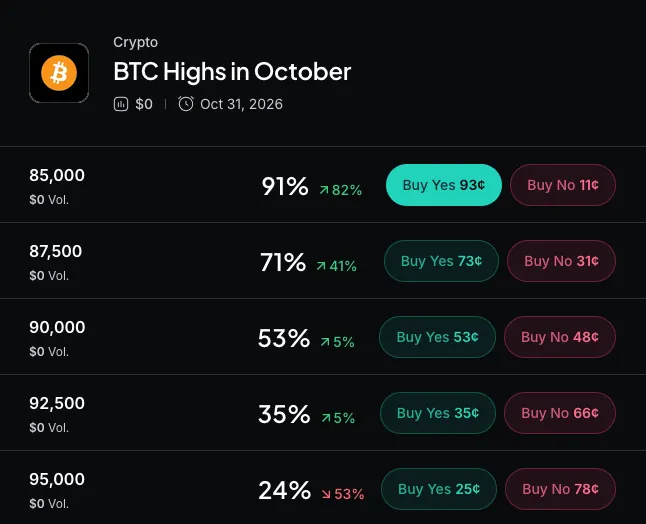
- Myriad traders put 48% odds on a $90,000 Bitcoin high in October and 7% on a new all-time high before 2027.
- The Fed hiked rates to 3.75%-4% on Sept. 16 and the 10-year yield hit 5.289%, while spot ETFs logged $148.69 million in outflows on Sept. 30.
It’s the start of October, otherwise known as “Uptober” in crypto circles for its historically stellar market performance, marking the end of “Red September”—which turned out not to be so red after all. So how will Bitcoin fare?
Bitcoin is starting October at $83,823, up 0.28% on the day, after a September that was on pace to be its best on record—until the last moment.
Bitcoin was up 7.33% for the month, with one trading day left, edging past 2024's 7.29% record for September. In the end, a correction made the coin close the month with a 6.33% gain; still green, still defying the Red September curse, but not a historical performance anymore.
Now comes the month crypto calls Uptober. October has returned 19.92% on average for crypto investors and 14.71% at the median since 2013, per CoinGlass.
Last year broke the script. October 2025 closed down 3.69%, only the third red October since 2013. So how will things turn out this year? The macro picture provides some context.
The Federal Reserve raised rates by 25 basis points on Sept. 16, to a range of 3.75% to 4%. It was the first hike since July 2023, and the vote was unanimous. Rising interest rates tends to be news for assets like Bitcoin, as “cheap money” becomes scarce and investing tends to turn towards safer bets, like Treasuries.

 →
→Fed Chair Kevin Warsh said inflation "remains elevated," and the Fed's median projection points to one more 25-basis-point hike this year. The next decision lands Oct. 28.
Bond yields got the message. The 10-year Treasury ended September at 5.289% and the 30-year at 5.632%, both 52-week highs. Bitcoin pays no yield, so traders tend to treat rising Treasury rates as direct competition.
Stocks aren't cheering the rate hike either. The S&P 500 and Dow both posted monthly losses in September as yields climbed. August PCE inflation did come in cooler than forecast, at 3.4% annually against 3.7% expected, with core at 3.0% against 3.3%.
Meanwhile, Bitcoin ETFs took in about $3.08 billion over nine straight days through Sept. 29. The streak ended Sept. 30 with $148.69 million in net outflows, according to Decrypt’s Bitcoin ETF tracker. Total net assets stand at over $101 billion, though data will vary by a few billion by tracking source.
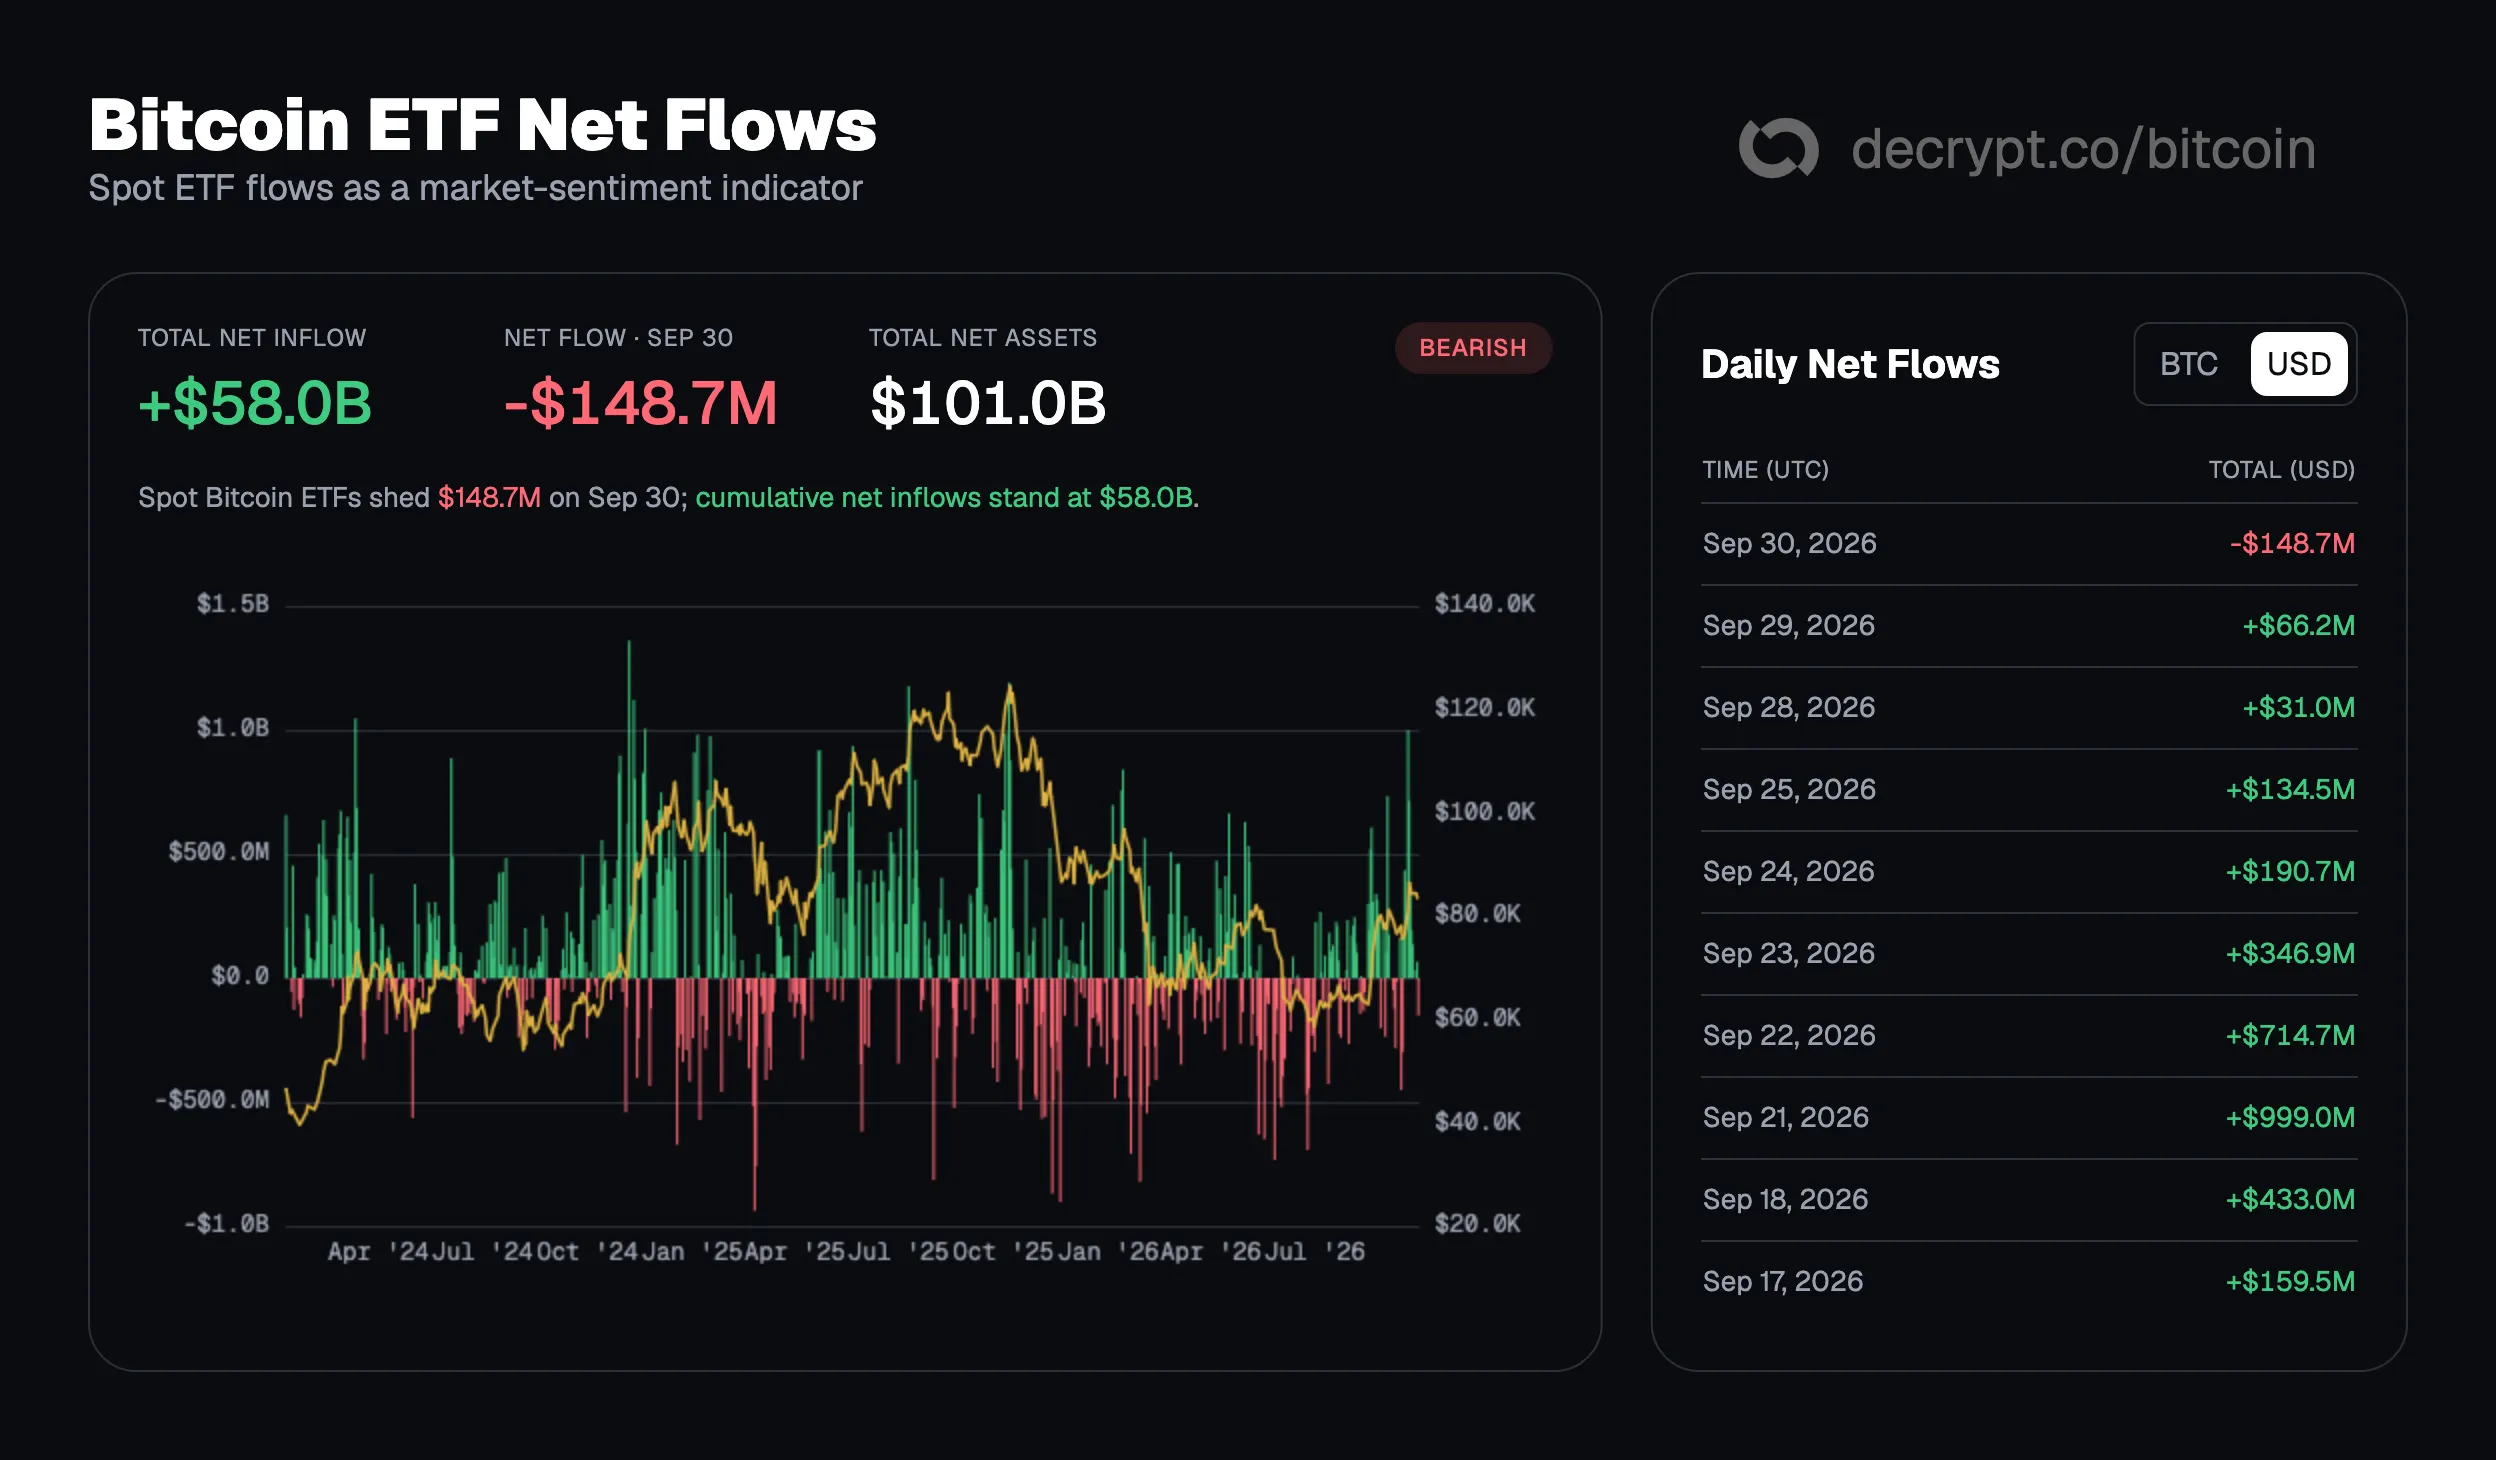
The week of Sept. 21 pulled in roughly $2.4 billion, including a $999 million day. This week so far is sitting at net outflows of $51.42 million.
On Myriad, a prediction market built by Decrypt's parent company Dastan, traders are placing 90% odds on Bitcoin hitting a high of $85,000—the safest bet of the bunch at the moment being that BTC stays flat. There’s currently a 70% chance Bitcoin hits $87,500, according to Myriad odds.
In a separate market, traders give just 7% odds that Bitcoin sets a new all-time high before 2027, a move of roughly 50% from here that is currently seen as highly unlikely.
Bitcoin price: strong trend, stalled advance
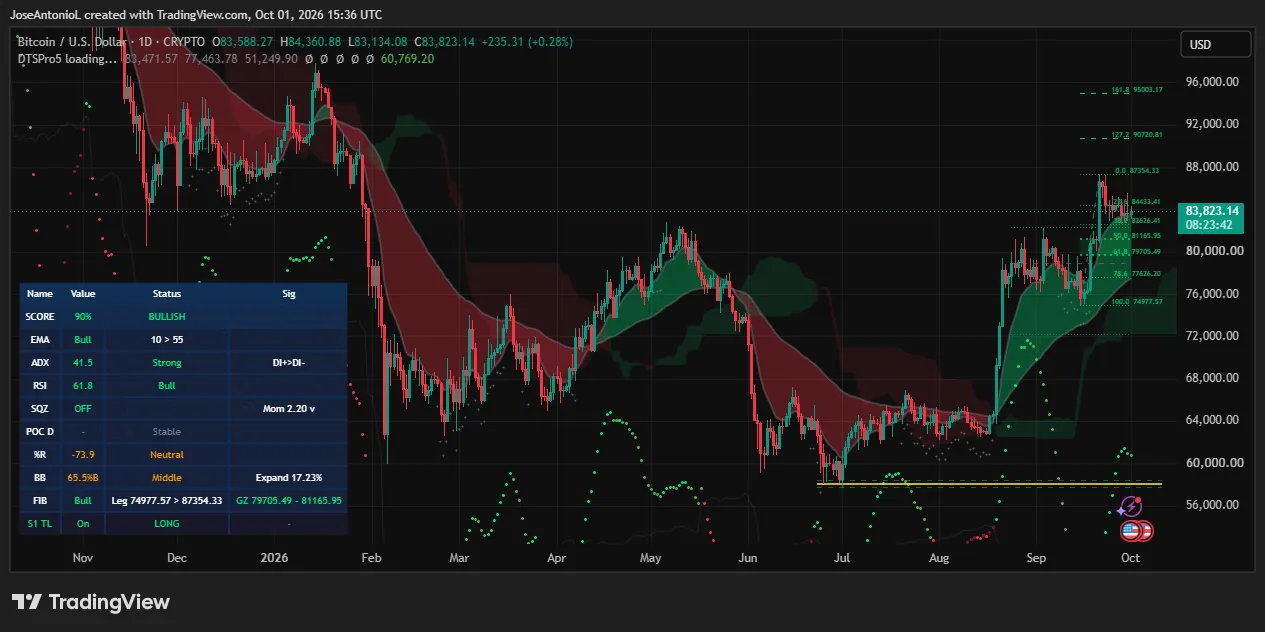
Today's daily candlestick opened at $83,588.27 and has ranged between $83,134.08 and $84,360.88. It sits at $83,823.14, inside the pullback from the $87,354.33 swing high that followed a bounce off $74,977.57.
The Average Directional Index, or ADX, measures how strong a trend is regardless of direction. It reads 41.5, well above the 25 line that confirms a real trend, and the positive directional line is above the negative one. Translation: buyers, not sellers, are driving this trend.
Exponential moving averages, or EMAs, weigh recent prices more heavily than old ones. The 50-day EMA sits above the 200-day, which signals the short-term trend is up.
The Relative Strength Index, or RSI, tracks buying momentum on a 0-to-100 scale. At 61.8 it shows bulls in charge without hitting the 70 mark where profit-taking usually starts. The Squeeze Momentum Indicator is "off," meaning the volatility compression has already been released, and Bollinger Bands, which track how far price strays from its average, are expanding.
As far as potential catalysts for the month, the calendar is packed. The September jobs report arrives Oct. 2, FOMC minutes on Oct. 7, CPI on Oct. 14, and the Fed decision on Oct. 28. Myriad's October market closes Oct. 31 at 11:59 p.m. ET.
Disclaimer
The views and opinions expressed by the author are for informational purposes only and do not constitute financial, investment, or other advice.