






In brief
- Bitcoin fell as low as $82,776.30 today and sits at $83,178.54, down 2.76% on the day, as oil climbed above $101 and bond yields climbed.
- The daily chart still shows a strong trend, but technical indicators show BTC near oversold territory.
- Myriad traders give 67% odds that Bitcoin touches $80,000 in October, and 55% that it touches $87,500.
Bitcoin had a rough morning. It opened today at $85,543.66, slid as low as $82,776.30, and now sits at $83,178.54. The drop appeared to scare off traders as the movement threatened to break a key support as BTC fell sharply within a few hours.
That 3.2% drop left leveraged traders holding the bag. Roughly $969 million in crypto positions were liquidated over the past 24 hours of which $644.47M were long positions, according to CoinGlass.
So what happened, and what comes next? Start with the culprit, because it isn't just a crypto story.
Stocks slip, oil climbs and bond yields spike
Wall Street is backing off record highs, with the S&P 500 down 0.59% to 7,772.60 and the Nasdaq off 0.71% in morning trading.
The reason is oil. Brent crude is back above $101 a barrel, the 10-year Treasury yield is near 5.34%, and the 30-year hit 5.70%, its highest since 2002. Even gold, the classic safe haven, dropped 1.53% to $4,123.10.
Oil is jumpy because ship attacks in and around the Strait of Hormuz keep piling up. The UK Maritime Trade Operations agency has logged at least one a day in the strait or the Gulf of Aden since October 2, Al Jazeera reports.
On Monday, Iran's Revolutionary Guard ordered a tanker entering the strait to turn around or risk attack. Pricier oil stokes inflation fears, which push yields up and hurt risk assets like Bitcoin.

 →
→Oil has bitten Bitcoin before. In June, it sank to $65,590 as Brent climbed to $96 on Middle East tensions. Bitcoin is still about 40% above the roughly $59,500 it traded at in late June.
The Federal Reserve adds to the nerves today with minutes from its September 15-16 meeting, per its calendar.
Bitcoin price: daily bulls, four-hour bears
The four-hour chart shows Bitcoin rejected near $86,978.45 before the slide began. The dip took prices below $83,000, when prices bounced, so traders have some reason to breathe.
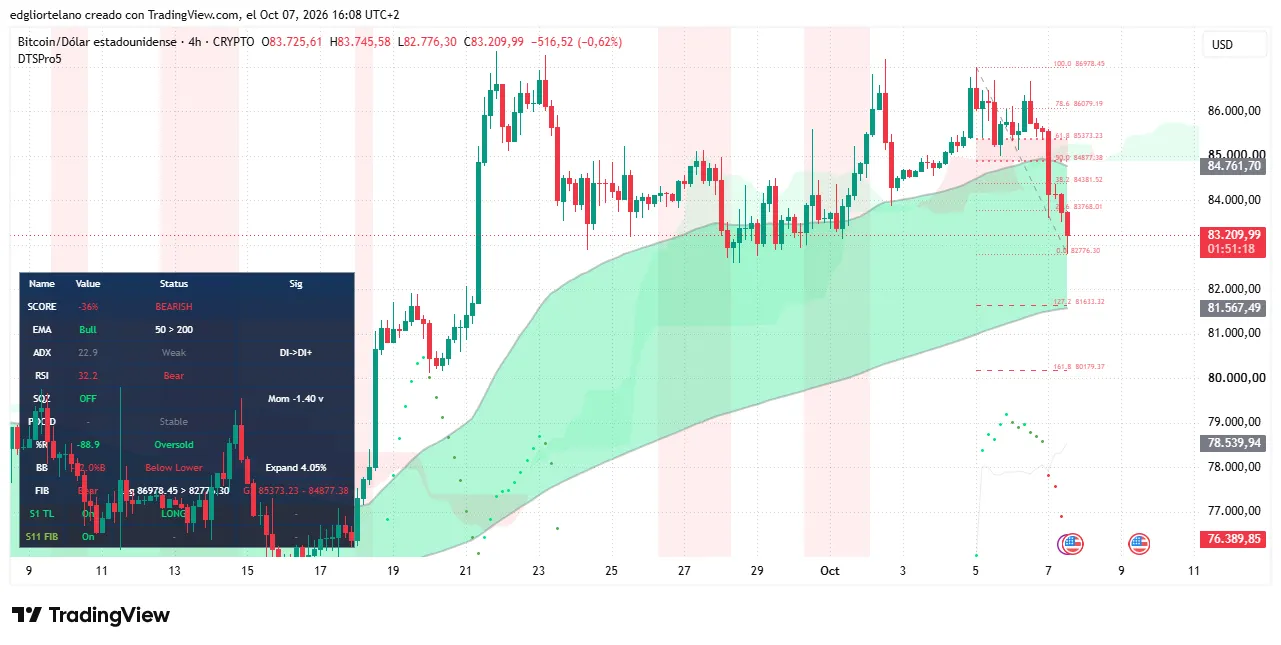
Fibonacci retracements are lines that mark where a price may pause, based on percentages of a prior move. Measured on that drop, the most relevant levels to watch on the intraday charts sit at $83,768.01 and $84,877.38. Both now act as resistance.
The Relative Strength Index, or RSI, in this short-term, four-hour window measures momentum on a 0-to-100 scale. At 32.2, Bitcoin is clearly oversold as shown by the quick panic attack. On the intraday session, this is a bearish momentum but also where bargain hunters tend to show up, expecting gains on longer time frames.
Zoom out and the daily charts and the Average Directional Index, or ADX, is 42.8, still a strong bullish trend, with buyers still ahead of sellers. The daily RSI in the daily candlestick reads 52.5, neutral, so this sell-off has barely dented momentum on the bigger timeframe.
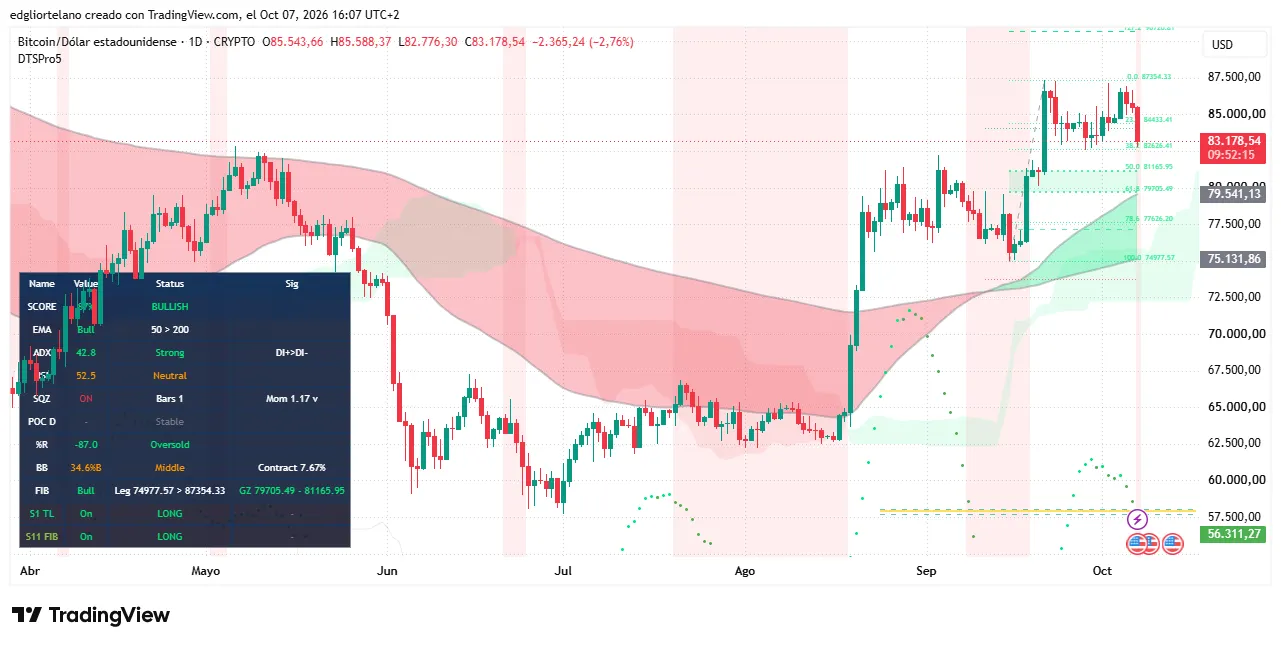
Exponential moving averages, or EMAs, track average price over a set window while weighting recent prices more. The 50-day EMA remains above the 200-day on both the daily and four-hour charts, which typically means the broader uptrend hasn't broken. The daily squeeze is still on, with a momentum reading of 1.17 that is slipping, meaning volatility remains compressed.
The daily low of $82,776.30 also stopped about $150 above the Fibonacci retracement around the $82,626.41 price line.
As oil and yields rose, stocks, gold and Bitcoin sold off together, which suggests this isn't a crypto-specific problem.
So, macro lit the fuse, but leverage fed the fire. When price falls, exchanges force-close leveraged positions that can no longer cover their losses. Those forced sales push the price lower still.
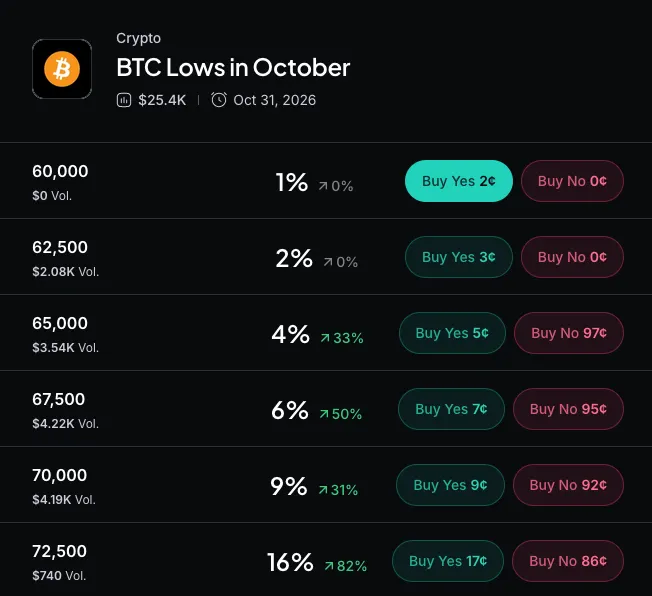
Traders on Myriad, a prediction market developed by Decrypt’s parent company Dastan, are already pricing in more pain. As of this writing, the BTC lows in October market gives 92% odds that Bitcoin touches $82,500 this month, 67% for $80,000 and 43% for $77,500.
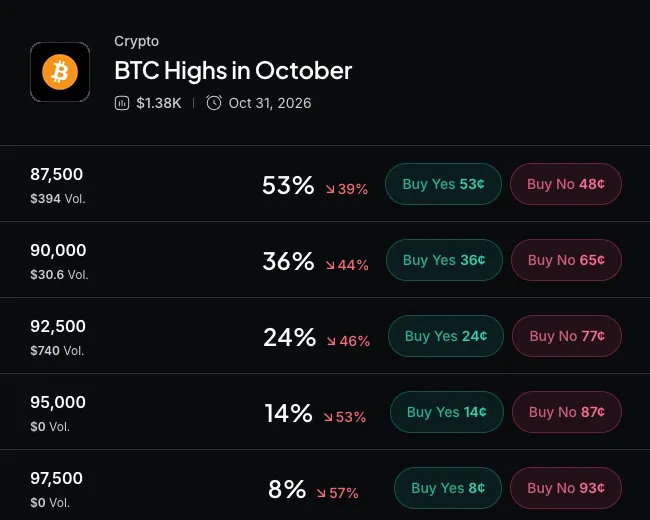
Upside bets are cooler. The BTC highs in October market has 55% odds on a touch of $87,500 and 36% on $90,000. Both markets pay out on Binance touches, not closes, so a drop and a rally can both resolve “yes” in the same month.
Bulls need to retake $84,761.70, the top of the four-hour trend band, and then the $84,877.38 retracement to argue the dip is over. If $82,776.30 gives way, the next stops are the four-hour band bottom at $81,567.49 and the daily 50% retracement at $81,165.95. The Fed minutes and any new Hormuz headlines are the catalysts to watch.
Disclaimer
The views and opinions expressed by the author are for informational purposes only and do not constitute financial, investment, or other advice.