

In brief
- The broader crypto market rally has stalled, with total market cap falling again today.
- But one token is swimming against the current: Mantle, or MNT.
- Mantle is building an Ethereum treasury, and ETH charts tell an interesting story of their own.
The cryptocurrency market is catching its breath after Monday's exuberance, with the market as a whole sliding 1.38% to $3.7 trillion on Tuesday. The crypto market saw broad gains over the past 24 hours, led by Ethereum layer-2 tokens which posted solid gains throughout the day. But today’s charts tell a different story as traders apparently lock in profits.
Still, there’s at least one token bucking the trend: Mantle, which trades as MNT on Coinbase and other exchanges, is up 8% today and nearly 25% over the last week. MNT is the native token of the Mantle network, previously known as BitDAO, a layer-2 Ethereum scaling network. But besides offering a platform for DeFi, Mantle recently began styling itself as a “Web3 Ethereum treasury,” boasting a $364 million ETH stash per listings on Strategic ETH Reserve.
Bullishness among investors chasing the crypto treasury trend may be playing into Mantle’s recent price gains.
So what do the charts have to say about it?
Mantle (MNT): Layer-2 momentum defies market downturn
Mantle stands out as today's contrarian play as easily the top gainer in the top 100 coins by market cap, despite broader market weakness.
Trading at $0.9389, MNT is up nearly more than 8% today and 24% in the weekly candlestick charts.
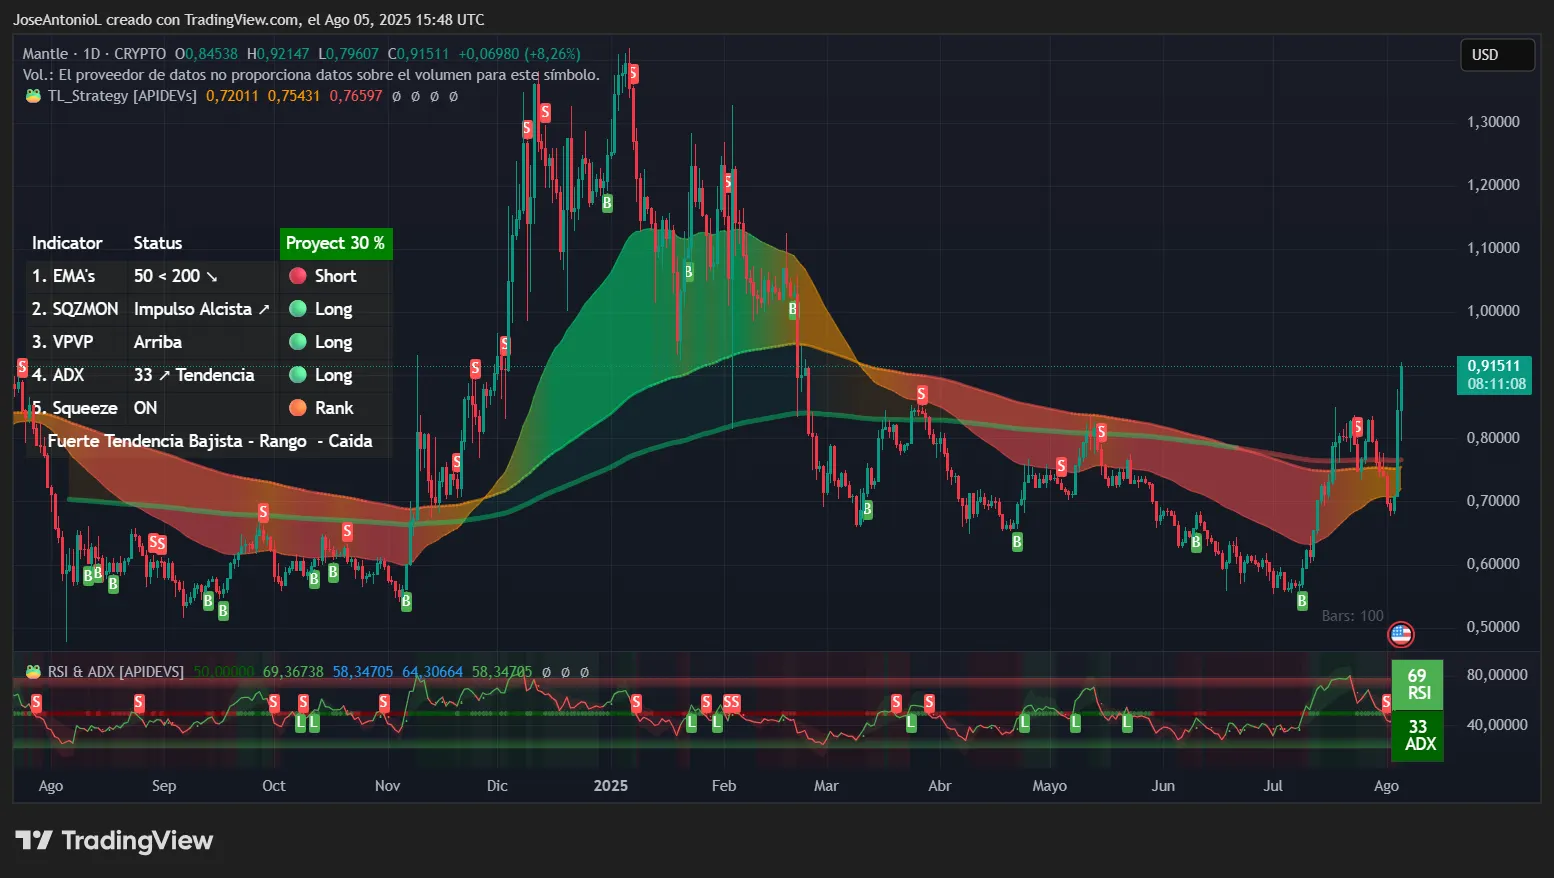
The technical setup for Mantle is decidedly bullish. The Average Directional Index, or ADX, at 33 confirms a strong trending environment. ADX measures trend strength regardless of direction on scale from 0 to 100, and crossing well above 25 separates choppy markets from trending ones.
For traders, this reading suggests the recent momentum isn't just noise but represents genuine directional conviction. When ADX readings sustain above 30, it often indicates a trend with staying power.
The Relative Strength Index, RSI, for Mantle is at 69, which means it’s approaching but hasn't yet reached overbought territory above 70. RSI functions as a thermometer to gauge how hot a market might be. Historical data shows many altcoins can sustain RSI readings between 65-75 for extended periods during bull runs, suggesting MNT could have more room to run before needing a breather.
The Squeeze Momentum Indicator shows markets are in a bullish momentum phase with a price compression period after a major spike. Given MNT's position above key support levels and the bullish momentum readings, the bias requires analysis alongside other indicators to be accurate.
The price direction shows traders are attempting to switch momentum from bearish to bullish. The gap between the long term average prices and the short term average prices is narrowing, hinting at a possible golden cross in the near future. If this happens, traders may have yet another confirmation of a bullish momentum instead of a simple correction or a FOMO-driven brief price spike.
What's driving this outperformance? Besides pure price action, the project’s move toward establishing itself as a “Web3 Ethereum treasury” is likely helping.
Mantle said in an X post last week that it’s now the largest ETH treasury among Web3 entities—that is to say, blockchain-native projects unlike publicly traded companies like SharpLink or BitMine, which lead the list among Ethereum treasuries as a whole.
What it amounts to is a signal to MNT investors that MNT is backed, in a sense, by an ostensibly less volatile asset in ETH.
Mantle is now listed on the Strategic ETH Reserve (SΞR).
As the largest ETH-backed treasury amongst Web3 entities, this reflects our conviction in Ethereum — not just as infra, but as the monetary layer powering decentralization and on-chain finance.
Slowly, then all at once. https://t.co/9JSU3TNDCs pic.twitter.com/VQ6v5UgbAU
— Mantle (@Mantle_Official) July 29, 2025
Also, MNT’s listing on Coinbase back in May coincided with a surge in interest in the coin. The “Coinbase Effect” as it relates to token listings is not nearly as pronounced as it has been in the past, but it’s still something. After all, Coinbase remains the most popular crypto exchange in the United States.
The recent launch of UR, a neobank that runs entirely on the Mantle network and the first of its kind to help users spend, save, and invest across fiat and crypto finances in one unified account, represents a notable milestone. With beta testing concluding on August 8, the market seems to be ready for a full rollout.
Key Levels:
- Immediate support: $0.82 (breakout level from multi-month resistance)
- Strong support: $0.75 (EMA resistance zone)
- Immediate resistance: $1.00 (psychological barrier)
- Strong resistance: $1.30 (next major technical target)
Ethereum (ETH): A technical crossroads
Of course, Mantle would be nothing without Ethereum, which is itself taking investors for a ride.
Ethereum currently trades at $3,583.3, showing signs of consolidation after recent volatility. The technical picture reveals a market at an inflection point, with longer-term indicators trending bullish and shorter-term indicators turning bearish.
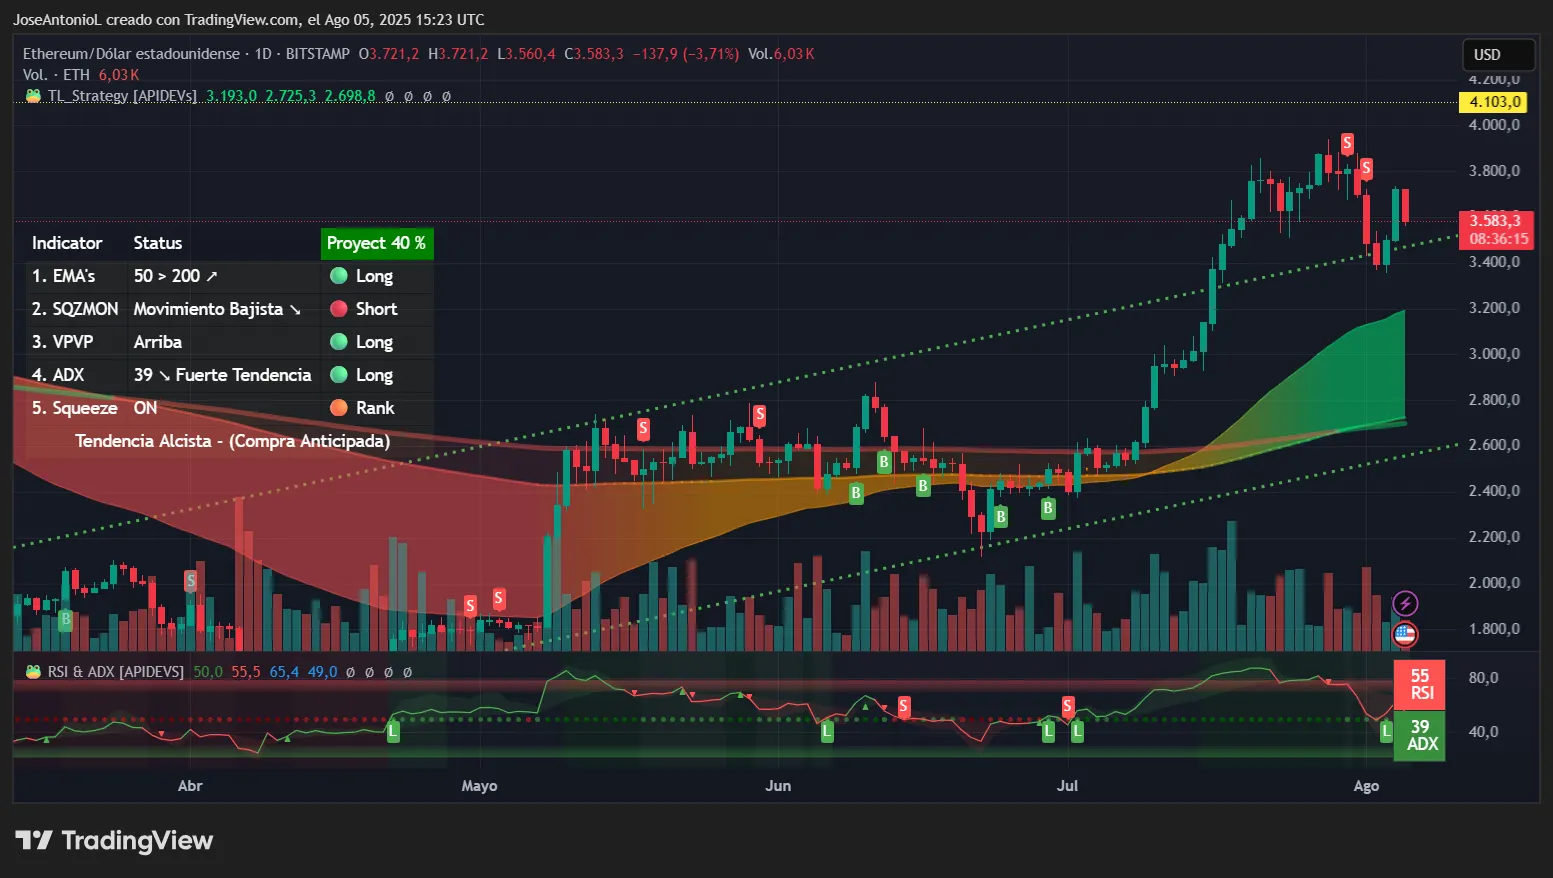
Ethereum’s ADX is at 39, which traders would interpret as decidedly bullish. It says the trend has room to keep up direction in the medium term. Anything above 40 on the ADX is serious momentum. At 39, Ethereum's trend strength is robust, and traders interpret this as confirmation that the current move has strong momentum behind it. But it's also approaching levels where some consolidation might be in order.
Of course, there will be ups and there will be downs, but if we’re zooming out, the overall direction of the movement is pretty clear.
The RSI for ETH sits at 55, placing ETH in neutral territory. It suggests traders are not as hyped as the trend strength suggests. RSI readings above 70 signal overbought conditions and below 30 indicate oversold levels. At 55, this suggests Ethereum has room to move in either direction without triggering automatic selling or buying from algorithmic trading setups.
This neutral reading combined with a strong ADX may indicate the market is digesting gains rather than showing exhaustion and heading to a new winter. We’re not there—yet.
The Exponential Moving Averages, or EMAs, also tell a bullish story for swing traders. The average price of ETH over the last 200 days is well below the average price over the last 50 days. That’s a bullish signal for most traders.
Moving averages help traders identify trend direction: when shorter-term averages (like the 50-day) trade above longer-term ones (like the 200-day), it shows sustained buying pressure across multiple timeframes.
Particularly significant is the Squeeze Momentum Indicator showing an “on” status. This indicator identifies periods when volatility compresses (the squeeze) before explosive moves. When it fires "on," it signals that a breakout from consolidation is underway. Combined with the strong ADX reading, this suggests traders should prepare for increased volatility.
The coin is also correcting after decisively breaking past the bullish channel that kept its gains going up but under a certain control. This seems to be the first time that resistance is testing its new configuration as a price support.
Key Levels:
- Immediate support: $3,400 (psychological level)
- Strong support: $3,200 (EMA50 resistance zone)
- Immediate resistance: $3,800 (recent rejection area and major Fibonacci level)
- Strong resistance: $4,000 (all-time-high territory)
Disclaimer
The views and opinions expressed by the author are for informational purposes only and do not constitute financial, investment, or other advice.