A significant chunk of Bitcoin has not moved in over seven years, markets insights platform Unfolded pointed out yesterday, citing data from “HODL Wave,” an indicator by on-chain analytics tool Glassnode.
This indicator tracks the time period between Bitcoin transactions and represents a macro view of how long a given coin is held before it is moved. It's named after a now-popular Bitcointalk post that told forum-goers in 2013 to continue hodling their Bitcoin instead of selling.
The HODL Wave shows more than 3.3 million Bitcoin has not moved in over seven years. That amount is 17.87% of Bitcoin’s circulating supply—and is worth a staggering $160 billion at current market prices.
According to @glassnode HODL waves, 3.3m #Bitcoin or 17.87% of circluting supply hasn’t been moved for over 7 years. pic.twitter.com/SEctpBlkkg
— unfolded. (@cryptounfolded) March 2, 2021
The unmoved Bitcoin is not necessarily “whales”—individuals with a large holding of Bitcoin—that are continuing to hold on to their Bitcoin to sell at better prices. A large number of Bitcoin have, in the past years, been lost in accidents, deaths, and forgotten passwords.
"Many of these early wallets has acquired Bitcoin at such a low value, or mined it and either lost it, forget it, or just cannot access it. Until 2013, Bitcoin was almost seen as monopoly money by many who didn't have the foresight to see what Bitcoin could become," explained Tim Frost, CEO of yield farming tool YIELD App, in a note to Decrypt.
A report last year by analytics firm Chainalysis pegged the lost Bitcoin figure a bit higher—on a slightly shorter timeframe—at almost 3.7 Bitcoin (or 20% of the circulating supply in the past five years). The same report stated that just 3.5 million Bitcoin was traded “actively” in the open market while 11.4 million Bitcoin was held as a “long-term” investment.
However, Frost says that there's always the off-chance that such Bitcoin are suddenly accessed by their owners. "These wallets sit as potential hammers that could drop on the market at any moment," he said.
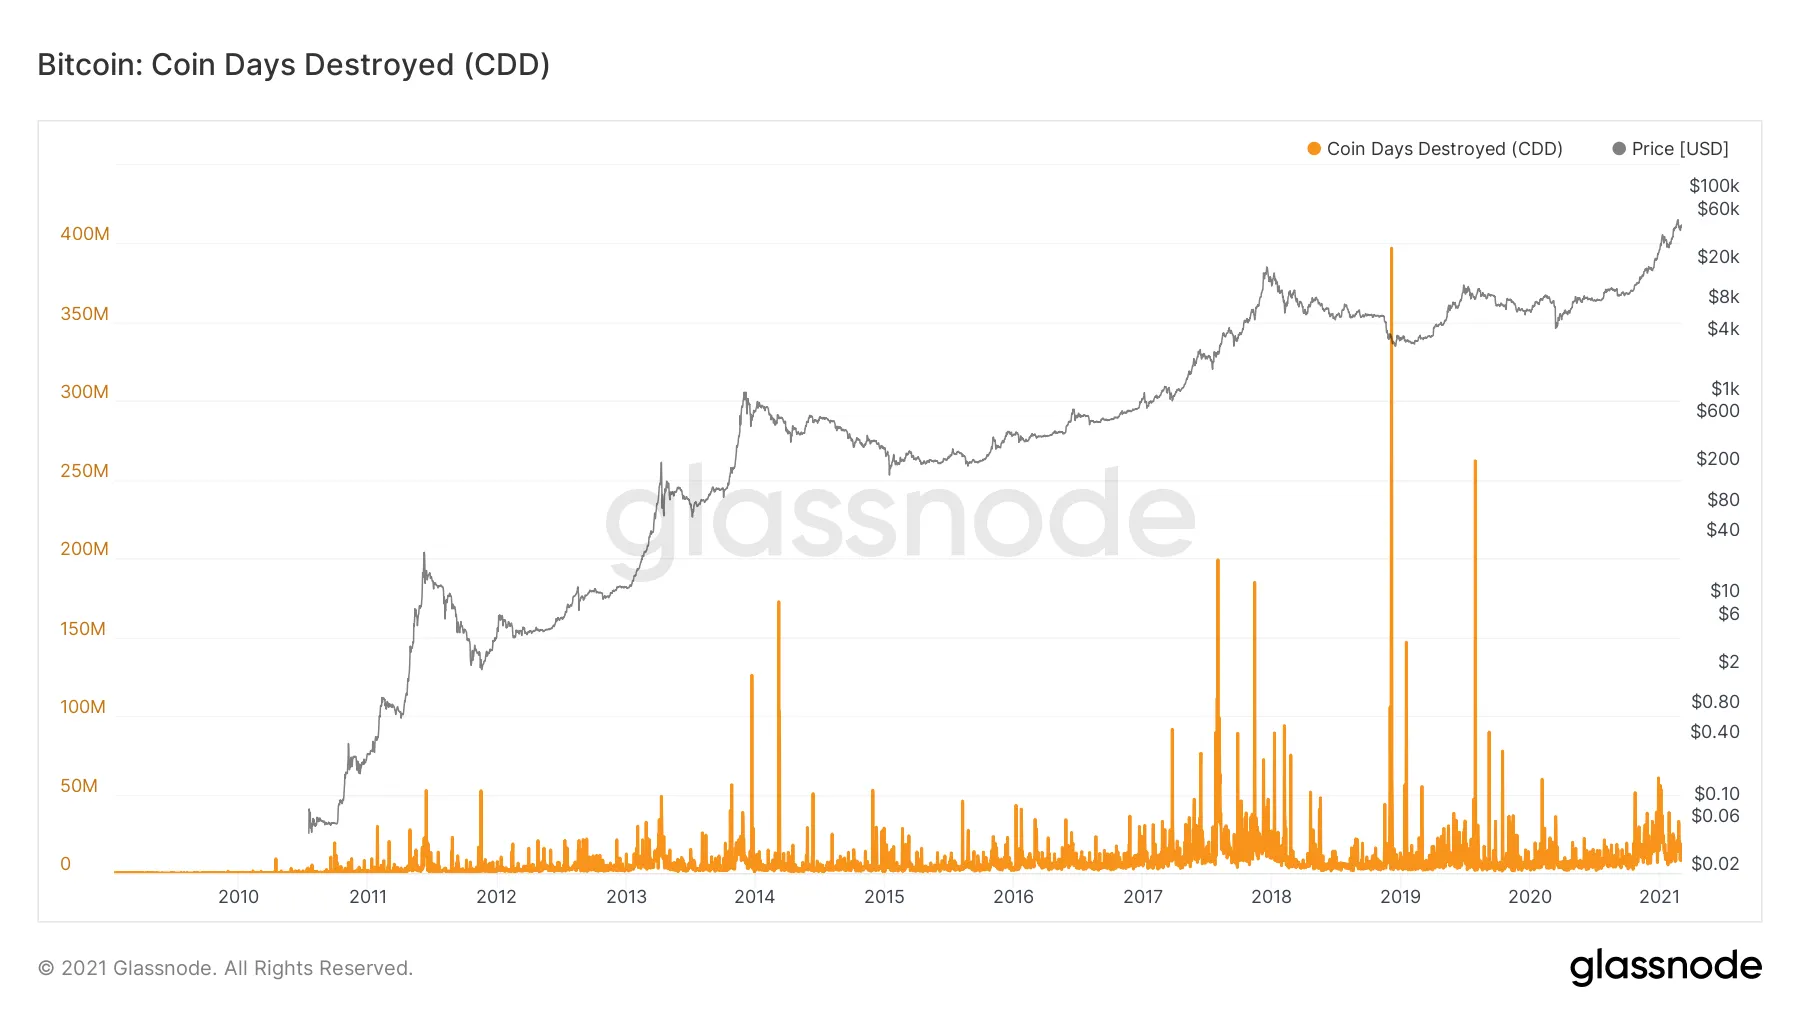
But it is possible to track that too. Glassnode has another indicators called Coin Days Destroyed that spikes when old Bitcoin is suddenly moved.

As we can see in the chart above, there were many spikes in late 2018 and during 2019 when very old coins moved for the first time in a long time. There has been some heightened activity in 2021 but nothing on the same level.

